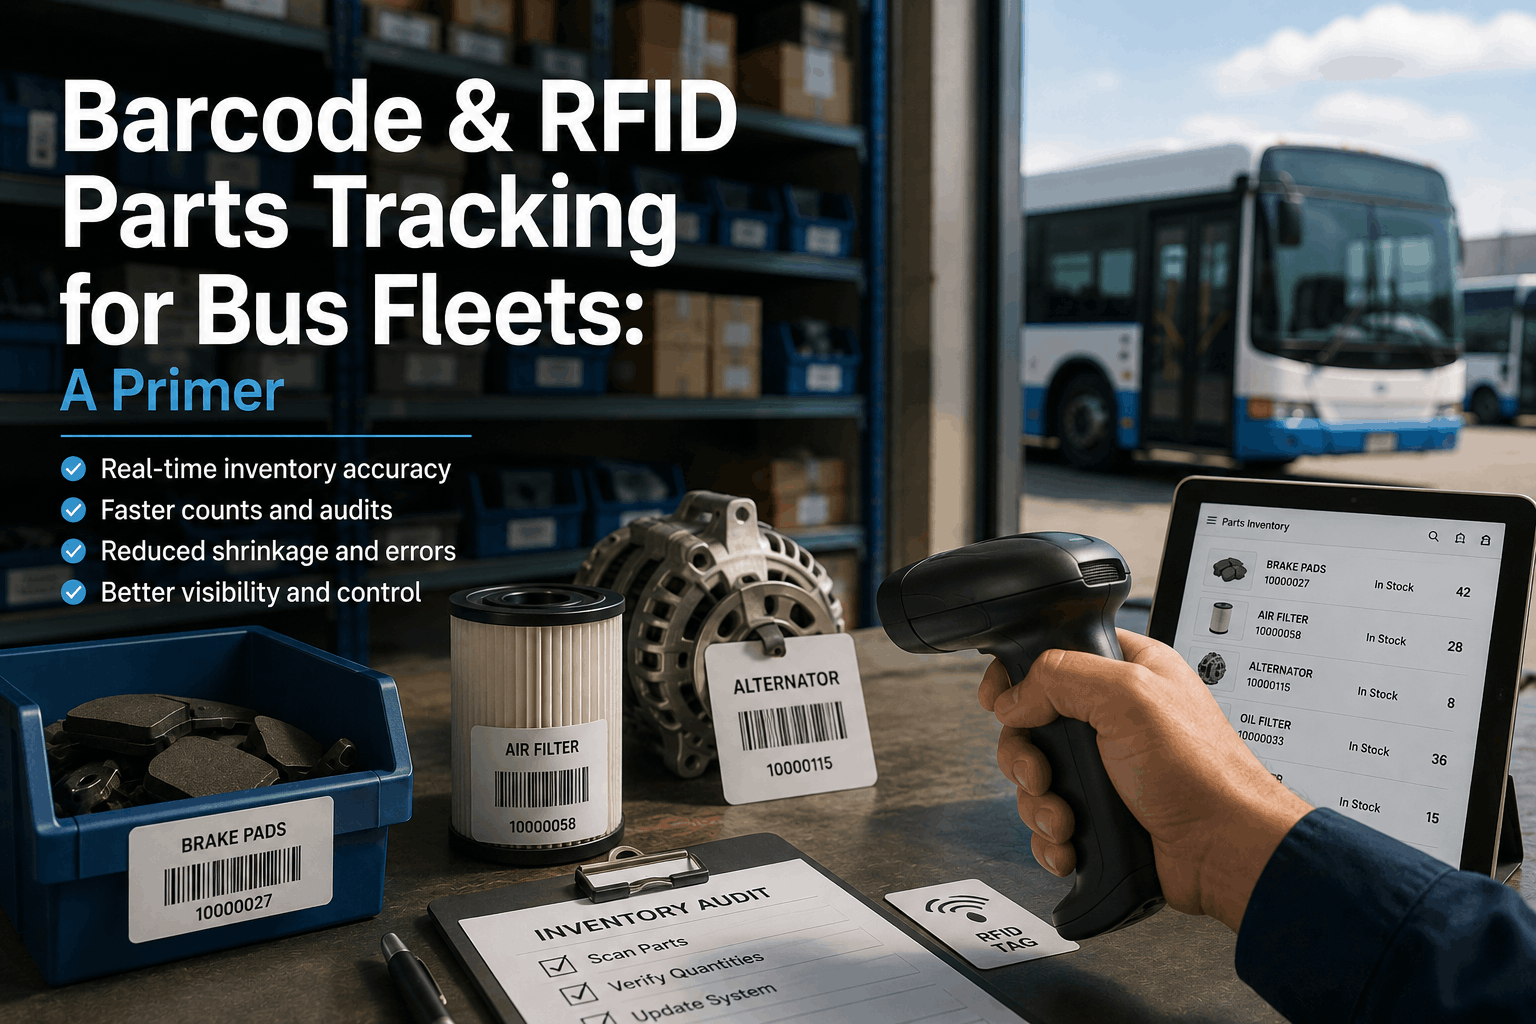
Manual parts inventory tracking destroys fleet profitability. A 150-bus fleet maintaining 3,500 unique parts SKUs through spreadsheets and physical counts experiences: 12–18% inventory shrinkage annually (parts missing, misplaced, or recorded incorrectly), $40,000–$65,000 in carrying costs from untracked obsolete stock, and 24–36 hours of labor monthly on manual counts that yield inaccurate data. Physical counts take time away from maintenance work, provide only point-in-time snapshots (data becomes stale in hours), and miss real-time usage patterns needed for data-driven purchasing. Barcode and RFID tracking technologies bring real-time accuracy to parts inventory, enabling automatic reorder triggers, shrinkage detection, and usage analytics. A barcode system costs $8,000–$15,000 to implement (scanners, labels, CMMS integration). RFID costs $25,000–$45,000. Both pay for themselves in 8–14 months through shrinkage reduction and optimized purchasing. This guide explains how barcode and RFID tracking work for bus fleets, when each technology makes sense, and how to implement with minimal operational disruption.
Barcode & RFID Parts Tracking for Bus Fleets: A Primer
Manual inventory counts waste 24–36 hours monthly and miss 12–18% of parts through shrinkage. Learn how barcode and RFID tracking bring real-time accuracy, eliminate stockouts and overstock, and pay for themselves in 8–14 months through shrinkage reduction and smarter purchasing.
Tracking Technology Comparison
Data from 95 North American fleet audits
The Hidden Cost of Manual Inventory Management
Manual parts inventory management relies on paper logs, spreadsheets, and periodic physical counts. The process works like this: technician removes a part from stockroom, writes part number on a log or updates a spreadsheet. At month-end, someone counts inventory physically and reconciles against the log. Discrepancies are noted but rarely investigated—they're assumed to be counting errors. In reality, they're shrinkage (theft, misplacement, wrong part installed). A 150-bus fleet with 3,500 SKUs maintains $400,000–$550,000 in parts inventory. Annual shrinkage of 12–18% represents $48,000–$99,000 in lost capital.
Beyond capital loss, manual management creates operational blind spots: slow-moving parts accumulate unnoticed (holding cost drain), fast-moving parts stockout unexpectedly (downtime), and reorder decisions are guesses instead of data-driven. The labor cost is also significant. A fleet stockroom attendant spends 24–36 hours monthly on physical counts, data entry, and reconciliation. At $28/hour fully loaded cost, that's $8,000–$14,000 annually in labor to get inaccurate data. Most fleet managers don't see this cost because it's buried in the stockroom operations budget. When visibility of total cost emerges—capital loss, carrying cost, labor waste—the decision to implement automated tracking becomes obvious.
Annual Cost of Manual Inventory (150-Bus Fleet)
Real-Time Tracking Benefits
Barcode Technology: How It Works for Bus Fleet Parts
Barcode tracking is the most cost-effective parts tracking solution for most fleets. Each part SKU is printed with a unique barcode label. When a part is received into inventory, the barcode is scanned (recording receipt). When a technician removes a part from stockroom, they scan the barcode (recording the transaction). At the time of maintenance, the part is scanned onto the work order. These scans create an automated, real-time transaction log in the CMMS. The system knows: what part, quantity, when it arrived, when it left stock, when it was used, and on which vehicle/work order.
From this data, the CMMS calculates: reorder levels, usage patterns, shrinkage detection, inventory turnover, and cost per vehicle type. Barcode scanning is manual (technician initiates the scan), so it requires discipline and training. If technicians don't scan consistently, data quality suffers. However, most fleets achieve 92–97% scanning compliance within 2–3 months of implementation through training and simple incentives (positive reinforcement, reporting accuracy metrics). The technology cost is modest: barcode scanners ($150–$300 per unit), barcode printer ($1,200–$2,200), and labels ($0.05–$0.15 per unit). Total initial investment for a 150-bus fleet: $8,000–$15,000. Annual operating cost: $2,000–$3,000 for labels and supplies.
Barcode Implementation — 6-Month Timeline
RFID Technology: Hands-Free Tracking for High-Value Assets
RFID (radio-frequency identification) takes tracking one step further: parts are tagged with small RFID chips instead of barcodes. When a tagged part enters an RFID reader zone (installed at stockroom exit, vehicle bays, parts receiving area), the chip automatically transmits its identification without manual scanning. RFID is superior to barcode in scenarios where: (1) high-value components (transmissions, engines, major assemblies) need to be tracked without human intervention, (2) technicians need speed (RFID reads multiple items per second vs. barcode one scan per second), and (3) harsh environments make barcode labels unreadable (oil, water, extreme temperature).
RFID doesn't require line-of-sight scanning—the reader detects chips even through cardboard, plastic, or metal containers. This hands-off automation makes RFID ideal for automatic receiving (parts arrived, RFID reader detects them, system updates inventory automatically) and for detecting unauthorized part removal (part leaves stockroom without authorization, reader triggers alert). For a 150-bus fleet with high-value drivetrain components, RFID reduces shrinkage risk for high-theft items to near-zero. However, RFID is more expensive: passive RFID tags cost $0.50–$2.00 per part (vs. $0.05–$0.15 for barcode labels), and RFID readers cost $3,000–$8,000 each (vs. $150–$300 for barcode scanners). Total RFID investment: $25,000–$45,000. Most fleets use hybrid approach: RFID for high-value items (10–15% of SKUs representing 60–70% of inventory value), barcode for the rest.
We implemented barcode tracking for all parts and added RFID gates for our transmission and engine stockroom. The barcode system paid for itself in 9 months through shrinkage reduction and eliminated manual counting. The RFID gates detected that someone was removing transmissions after hours—they weren't formally checked out. That one discovery prevented $120,000+ in theft. The combination of barcode and RFID is powerful for fleet security and accuracy.
Barcode vs. RFID Comparison
Hybrid Implementation (150-Bus Fleet)
Integration with CMMS: Making Tracking Data Actionable
Barcode and RFID data is only valuable when integrated into a computerized maintenance management system (CMMS). The CMMS connects tracking data to maintenance work orders, creating a complete audit trail: part SKU, quantity, cost, received date, used date, vehicle type, maintenance type, and technician. From this integrated data, the CMMS automatically calculates: (1) usage patterns (how often each part is used, by vehicle type, by maintenance type), (2) reorder levels (when to order, how much to order based on demand), (3) shrinkage (difference between scanned transactions and physical counts), (4) cost per vehicle type (how much each bus costs to maintain), and (5) parts availability (which parts are in stock, which are on order, which are obsolete).
This intelligence powers data-driven maintenance management. For example, if the CMMS tracking data shows that your 40-bus articulated fleet consumes 160 air filters annually (4 per bus) with 2-week lead time, it recommends maintaining 60 filters in stock (2-week buffer + safety stock). Without this data, fleet managers guess and maintain 80–120 filters, tying up unnecessary capital. Over 12 months, proper reorder levels informed by tracking data save 15–25% in carrying costs. Additionally, integrated CMMS data enables predictive maintenance. If tracking shows that alternators on your 2012-model buses are failing at 18-month intervals (vs. 36 months for 2015 models), the CMMS flags these buses for preventive alternator replacement, avoiding unexpected downtime.
CMMS Integration ROI — 18-Month Cycle (150-Bus Fleet)
Implementation Best Practices: Rolling Out Tracking Without Disrupting Operations
Barcode and RFID implementation can be disruptive if not executed carefully. The worst approach is a big-bang cutover: shut down operations, label all 3,500 parts, train everyone, go live all at once. This creates chaos. The smarter approach is phased rollout: start with barcode, focus on 1,000 most-used SKUs first, train one technician team at a time, run manual reconciliation in parallel with automated tracking for 4–6 weeks, then expand to remaining SKUs. This phased approach maintains operational continuity and allows refinement of workflows before full-scale deployment.
Key implementation steps: (1) assign unique part numbers to all SKUs (if not already done); (2) set up CMMS to accept barcode scans on work orders and inventory transactions; (3) procure barcode scanners and printer; (4) print labels for initial 1,000 SKUs; (5) train stockroom staff and first mechanic team; (6) run in parallel (manual + barcode) for 4–6 weeks; (7) measure compliance rate and refine training; (8) expand to additional SKUs in batches; (9) achieve 92–97% compliance; (10) measure results (shrinkage, labor, accuracy). Parallel running is critical. It allows staff to maintain normal workflows while learning the new system, and it prevents data loss if scanning fails. Most fleets see 92–97% scanning compliance within 8–12 weeks of phased rollout.
Big-Bang Implementation (Not Recommended)
Label all 3,500 parts over 2 weeks; high cost, high error risk
Train entire organization at once; overwhelmed staff, low compliance
Cut over all at once; immediate data quality problems, operational chaos
Parallel run not performed; no safety net if system fails
Result: 40–60% initial compliance, high frustration, project delays
Phased Implementation (Recommended)
Phase 1: Label top 1,000 SKUs; train 1 technician team over 2 weeks
Phase 2: Parallel run (manual + barcode) for 4–6 weeks; measure and refine
Phase 3: Expand to 2,500 SKUs in batches; train additional teams over 4 weeks
Phase 4: Measure compliance; reach 92–97% by month 3; full rollout by month 6
Result: 92–97% compliance, smooth adoption, high staff buy-in, continuous improvement
Plan phased rollout for your fleet — schedule planning session
Inventory Technology Expert Review
Manual parts inventory management is expensive and unreliable. A typical fleet loses $80,000–$120,000 annually to shrinkage, carrying cost, and labor waste. Barcode tracking solves this with modest investment ($8,000–$15,000) and straightforward implementation. Barcode ROI is typically achieved in 8–14 months through shrinkage reduction and labor savings. RFID adds sophistication and hands-free automation for high-value items, but at higher cost ($25,000–$45,000). Most fleets benefit from hybrid approach: barcode for 85% of SKUs, RFID for 15% of high-value components.
The technology only creates value when integrated into a CMMS, which connects tracking data to maintenance work orders and generates actionable intelligence: usage patterns, reorder recommendations, cost-per-vehicle analysis, and predictive maintenance insights. BusCMMS is specifically designed for this integration, automatically processing barcode scans into maintenance analytics and generating reorder recommendations. Phased implementation (not big-bang) ensures smooth adoption and 92–97% compliance within 3–6 months. Fleets implementing barcode/RFID tracking with CMMS integration typically achieve $80,000–$120,000 in annual savings plus improved asset management and uptime.
The Bottom Line
Manual parts inventory management creates hidden costs: 12–18% annual shrinkage, 24–36 hours monthly labor waste, and blind spots that lead to stockouts and overstocking. Barcode tracking eliminates these costs through automated transaction logging, real-time inventory visibility, and data-driven reorder management. Implementation cost is modest ($8,000–$15,000), and ROI timeline is 8–14 months. RFID adds hands-free automation for high-value items but at higher cost ($25,000–$45,000). Hybrid approach (barcode + RFID) balances cost and benefits.
The critical success factor is CMMS integration, which connects tracking data to maintenance intelligence. Phased implementation over 6 months ensures smooth adoption and high staff compliance. Fleet operators using barcode tracking with CMMS integration consistently report $80,000–$120,000 in annual savings plus significantly improved asset management and operational reliability.
Stop Losing 12–18% of Parts Inventory to Shrinkage.
Barcode and RFID tracking bring real-time accuracy, eliminate manual counting, and enable data-driven reorder management. ROI in 8–14 months through shrinkage reduction and labor savings. BusCMMS integrates barcode scanning into maintenance workflows and generates automatic reorder recommendations. Free 14-day trial.
Frequently Asked Questions
How much does barcode tracking cost to implement?
What's the difference between barcode and RFID?
How much shrinkage reduction should we expect?
Will barcode scanning add burden to technicians?
Can we do barcode without CMMS integration?
How long does implementation take without disrupting operations?
What's the best way to prevent shrinkage: barcode or RFID?
How does CMMS-integrated barcode improve parts ordering?
Real-Time Inventory Visibility. Automatic Reorder Intelligence.
Barcode and RFID tracking with CMMS integration eliminate shrinkage, reduce carrying cost, and enable data-driven procurement. 150-bus fleets see $80K–$120K annual savings. Start your tracking strategy today.


