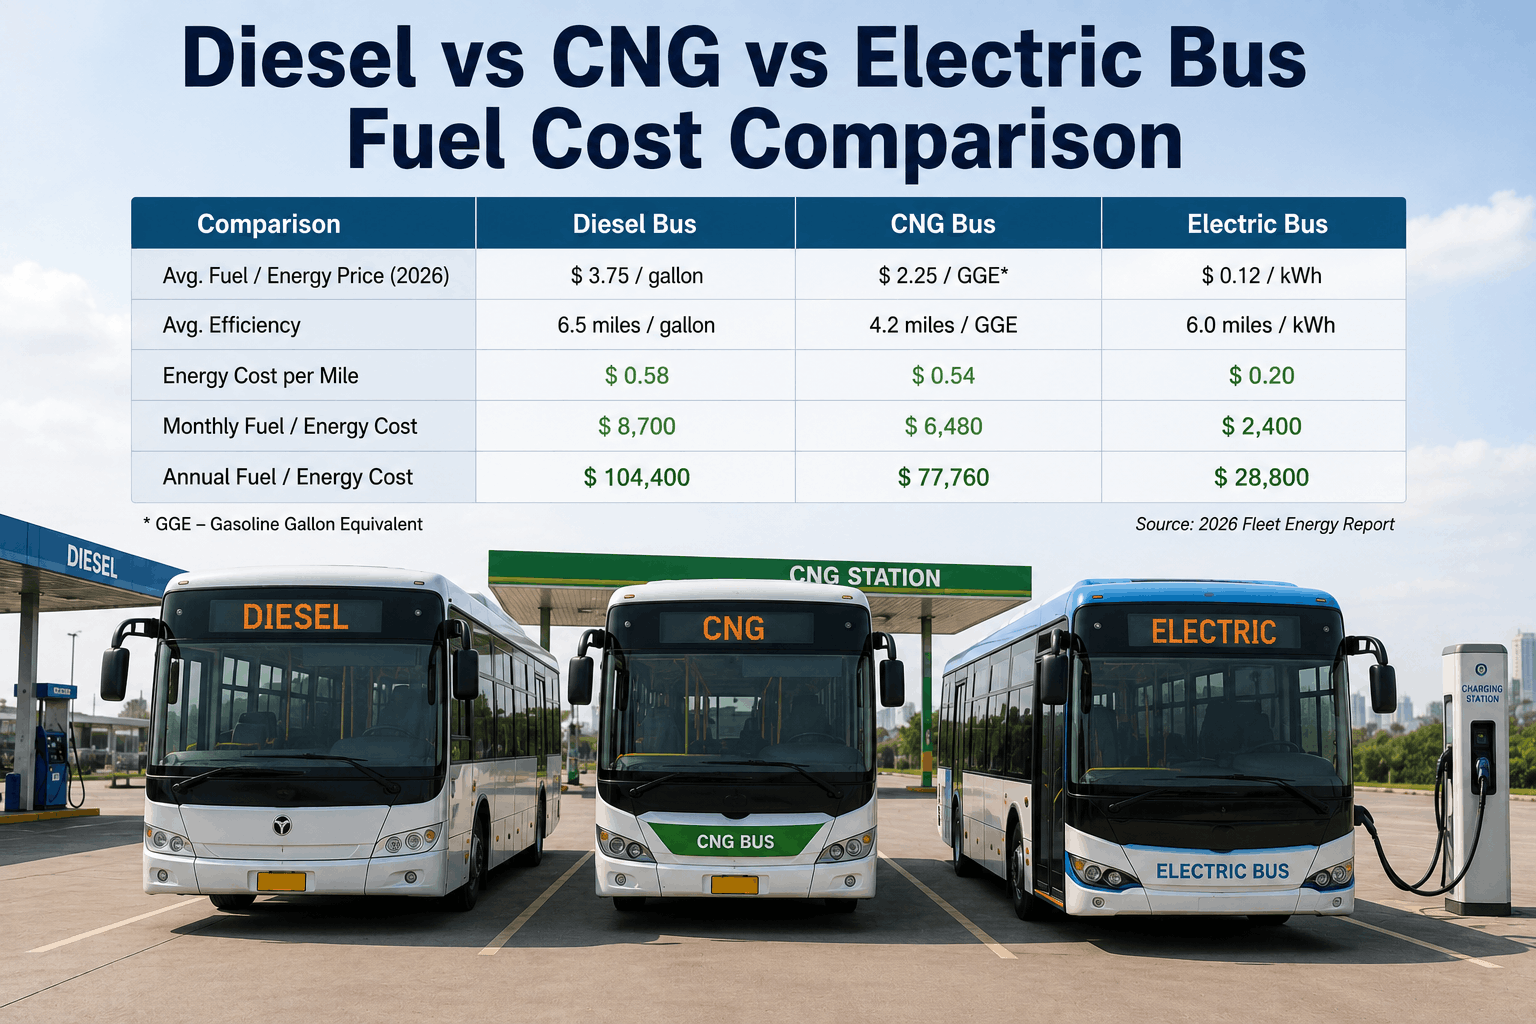
Which fuel costs least to run? The answer changes depending on your region, mileage, and infrastructure. In California, with high diesel prices and subsidized electricity, electric buses have the lowest per-mile energy cost. In Texas, where natural gas is abundant and cheap, CNG often wins. In rural Midwest districts with older diesel infrastructure and no access to gas mains, diesel remains the most cost-effective despite higher fuel prices. This guide compares diesel, CNG, and electric bus energy costs using 2026 fleet data — fuel prices, maintenance impacts, infrastructure costs, and break-even mileage. No manufacturer claims. No theoretical models. Just real numbers that fleet managers use to make multi-million dollar fuel decisions.
Diesel vs CNG vs Electric Bus Fuel Cost Comparison
Real per-mile energy costs. Infrastructure investment. Maintenance differences. Break-even analysis. Data-driven fuel decisions.
Average Energy Cost per Mile (2026 National Avg)
Electric per-mile energy cost is lowest. Infrastructure and vehicle price change total cost of ownership. Analyze your specific scenario.
Diesel Bus Fuel Costs: The Baseline
Diesel remains the baseline for bus fuel cost comparison. National average price (2026): $3.80-4.20 per gallon. School bus fuel economy: 5.0-7.0 MPG on mixed routes. Transit bus economy: 3.5-5.0 MPG. Charter/coach: 6.0-8.5 MPG. Per-mile fuel cost calculation: price per gallon ÷ MPG. At $4.00/gal and 6 MPG = $0.667 per mile. For a 100-bus fleet each driving 30,000 miles annually, diesel fuel cost = $2.00 million per year.
Diesel advantages: existing infrastructure at almost every depot. Mature technology with predictable maintenance. No range constraints. Fuel available everywhere. Disadvantages: highest per-mile energy cost of the three options. Diesel prices are volatile (range $2.50-5.50 over past five years). Emissions compliance costs (DPF, DEF, SCR) add operational expense.
Diesel Cost per Mile — By Fuel Price & MPG
Diesel per-mile cost is 2x electric but vehicle price is lower. Analyze total cost of ownership, not just fuel.
"We compared fuel costs across our 120-bus fleet last year. Diesel buses averaged $0.71 per mile in fuel. Our 8 electric buses averaged $0.29 per mile. That's $0.42 per mile difference. On 30,000 miles per bus, that's $12,600 per bus annually — $1.5 million for the whole fleet. The challenge is upfront vehicle cost and charging infrastructure. The fuel savings are real. The payback period is what you need to calculate for your operation."
CNG Bus Fuel Costs: Lower Price, Lower Efficiency
Compressed Natural Gas (CNG) offers lower fuel price but lower energy density. CNG price: typically $2.00-3.00 per diesel gallon equivalent (DGE). One DGE has same energy content as one gallon of diesel. CNG bus fuel economy: 3.5-5.0 MPGe (miles per gallon equivalent) — about 15-20% lower than diesel because CNG has less energy per volume and engines are slightly less efficient. Per-mile fuel cost: $0.50-0.75 per mile depending on local gas prices. At $2.50/DGE and 4 MPGe = $0.625 per mile.
CNG advantages: lower fuel price than diesel in most regions. Stable pricing (less volatile than oil). Lower emissions (reduced NOx and particulate matter). Domestic fuel source. Disadvantages: requires specialized fueling infrastructure ($500,000-2 million for a depot station). Lower efficiency means higher consumption. Shorter range than diesel (250-350 miles vs 500+ for diesel). Heavier fuel tanks reduce payload. Maintenance costs for CNG-specific components (high-pressure fuel system, spark plugs, catalytic converter).
CNG Cost per Mile — By DGE Price & MPGe
CNG economics depend heavily on regional gas prices. Texas, Oklahoma, Pennsylvania (low gas) = competitive. New England, California (higher gas) = less attractive.
Electric Bus Energy Costs: Lowest Per Mile (With Caveats)
Electric buses have the lowest per-mile energy cost when measured correctly. Energy consumption: 1.8-2.5 kWh per mile (average 2.2 kWh/mi). Electricity price: commercial/industrial rates $0.10-0.18 per kWh. Base energy cost = 2.2 kWh × $0.14 = $0.308 per mile — roughly half the cost of diesel. However, demand charges change the math significantly. Charging 8 buses simultaneously at 150 kW each = 1.2 MW demand. Utility demand charges ($10-20 per kW per month) add $12,000-24,000 monthly to your electric bill.
Effective cost per mile including demand charges: $0.40-0.55 depending on charging strategy. Smart charging (staggered starts, managed load) reduces demand charges. Fleets that charge overnight with lower rates and managed load achieve $0.30-0.35 per mile. Fleets that fast-charge during peak pay $0.50-0.65 per mile.
Electric Bus Energy Cost — Scenarios (2.2 kWh/mi)
Demand charges are the hidden cost of electric bus charging. A fleet that ignores demand charges will pay 2x the expected energy cost. Smart charging software is not optional — it's required for cost-effective EV operation.
Calculate electric bus energy costs including demand charges — book a demo
Maintenance Cost Comparison: Beyond Fuel
Fuel is only part of operating cost. Maintenance differs significantly by fuel type. Diesel: highest maintenance cost. Oil changes every 5,000-10,000 miles. DPF/SCR emissions system maintenance. Turbochargers, injectors, EGR systems. Transmission service. Average maintenance cost: $0.50-0.65 per mile. CNG: similar to diesel but spark plugs (replacement every 30,000-50,000 miles) and high-pressure fuel system components add cost. No DPF/SCR system on most CNG engines (spark-ignited engines meet emissions without aftertreatment). Average maintenance cost: $0.45-0.60 per mile.
Electric: lowest maintenance cost. No oil changes, no transmission service, no exhaust system, no fuel filters, no belts. Brakes last 2-3x longer due to regenerative braking. Average maintenance cost: $0.15-0.25 per mile. Electric maintenance savings are significant — $0.30-0.40 per mile less than diesel. On 30,000 annual miles, that's $9,000-12,000 per bus per year.
Diesel Maintenance (per mile)
Oil & filters — $0.12-0.18
DPF/SCR/DEF — $0.08-0.12
Transmission service — $0.05-0.08
Belts, hoses, cooling — $0.05-0.07
Brakes (2-3x electric) — $0.05-0.08
Total: $0.50–0.65 per mile
Electric Maintenance (per mile)
Cabin air filter only — $0.01-0.02
Coolant checks — $0.01-0.02
HV cable inspection — $0.01-0.02
Brake inspection (rare replacement) — $0.02-0.03
Tires only — $0.03-0.05
Battery SOH check (warranty) — $0.02-0.03
Total: $0.15–0.25 per mile — saves $10,000+ per bus annually.
Infrastructure Costs: The Upfront Hurdle
Infrastructure costs differ dramatically by fuel type. Diesel: existing depot fuel tanks (already paid for). Minimal new infrastructure required. CNG: requires compressed natural gas fueling station at depot. Cost: $500,000-2,000,000 depending on capacity (slow-fill vs fast-fill). Requires gas utility connection or on-site compressor. Annual maintenance: $10,000-30,000 for station. Electric: requires depot charging infrastructure. Level 2 chargers (19.2 kW): $3,000-7,000 per charger plus electrical panel upgrades. For 100 buses: $300,000-700,000 in chargers plus $200,000-500,000 for site electrical upgrades.
DC fast chargers (60-90 kW): $50,000-150,000 per charger — typically for transit fleets requiring mid-day top-ups. Infrastructure payback period: CNG station payback is 5-10 years depending on fleet size and gas prices. Electric charger payback is 2-5 years from fuel savings. Diesel has no new infrastructure cost for existing fleets.
Infrastructure Cost per Bus
"We priced out CNG vs electric for our 80-bus fleet. CNG station: $1.2 million. Electric L2 charging: $600,000 for chargers plus $400,000 for panel and transformer upgrades — $1.0 million total. Electric had lower infrastructure cost AND lower fuel cost. The decision was easy. But we have cheap electricity ($0.11/kWh) and moderate gas prices. Every fleet's numbers are different."
Total Cost of Ownership (TCO) Comparison
Combining vehicle price, fuel cost, maintenance, and infrastructure, which fuel type has lowest total cost of ownership? Diesel: lowest vehicle price ($350,000-450,000 for new school bus). Highest fuel and maintenance cost. CNG: moderate vehicle price ($380,000-500,000). Lower fuel cost (depending on region) but higher infrastructure amortization. Electric: highest vehicle price ($450,000-650,000 — though falling). Lowest fuel and maintenance cost. Infrastructure cost varies.
Break-even mileage for electric vs diesel: 30,000-60,000 miles per year depending on electricity price and diesel price. For school buses (12,000-15,000 miles annually), electric payback period is 8-12 years — often longer than bus ownership cycle. For transit buses (30,000-50,000 miles annually), electric payback is 4-7 years. CNG is in between — best for fleets with cheap natural gas and high annual mileage.
Total Cost of Ownership (12-year lifecycle, per bus)
High-mileage fleets (30k+ miles/year) favor electric. Low-mileage (under 15k/year) favor diesel. CNG is best for fleets with cheap gas and moderate mileage.
Fleet Expert Review
The cheapest fuel per mile is electricity — by a wide margin. But total cost of ownership depends on vehicle price, infrastructure, and annual mileage. Transit buses (30k-50k miles/year) achieve electric payback in 4-7 years. School buses (12k-15k miles/year) have 8-12 year payback — often longer than the bus ownership cycle. CNG is regionally competitive — cheap in gas-producing states, expensive elsewhere. Diesel remains the most predictable and lowest upfront cost option. The decision isn't which fuel is "best" — it's which fuel is best for YOUR fleet's mileage, region, and infrastructure. Model your numbers. Don't guess.
The Bottom Line
Electric offers the lowest per-mile energy cost ($0.30-0.35) but highest vehicle price and infrastructure investment. Diesel offers highest per-mile fuel cost ($0.65-0.75) but lowest upfront cost and no new infrastructure. CNG sits in the middle — lower fuel price than diesel, lower efficiency, and significant station infrastructure cost. The right choice depends on your fleet's annual mileage, regional fuel and electricity prices, access to infrastructure grants, and operational requirements (range, refueling time).
BusCMMS tracks fuel costs per mile across all fuel types — diesel, CNG, electric, and others. Compare actual data from your fleet, not national averages. Make fuel decisions based on your numbers.
Every Fuel Type. Every Cost. One Dashboard.
Track diesel, CNG, and electric energy costs per bus. Compare maintenance costs. Analyze TCO by fuel type. Free 14-day trial.
Frequently Asked Questions
What is the cheapest fuel type for school buses?
How many miles per year does an electric bus need to be cost-effective?
What are demand charges for electric bus charging?
Is CNG cheaper than diesel for buses?
How much does CNG fueling infrastructure cost for a bus depot?
Can BusCMMS track fuel costs per mile across different fuel types?
Diesel + CNG + Electric + Hybrid. All Fuel Types. One System.
Fuel cost per mile. Maintenance cost per mile. Total cost of ownership. All fuel types. All on one dashboard. Free 14-day trial.


