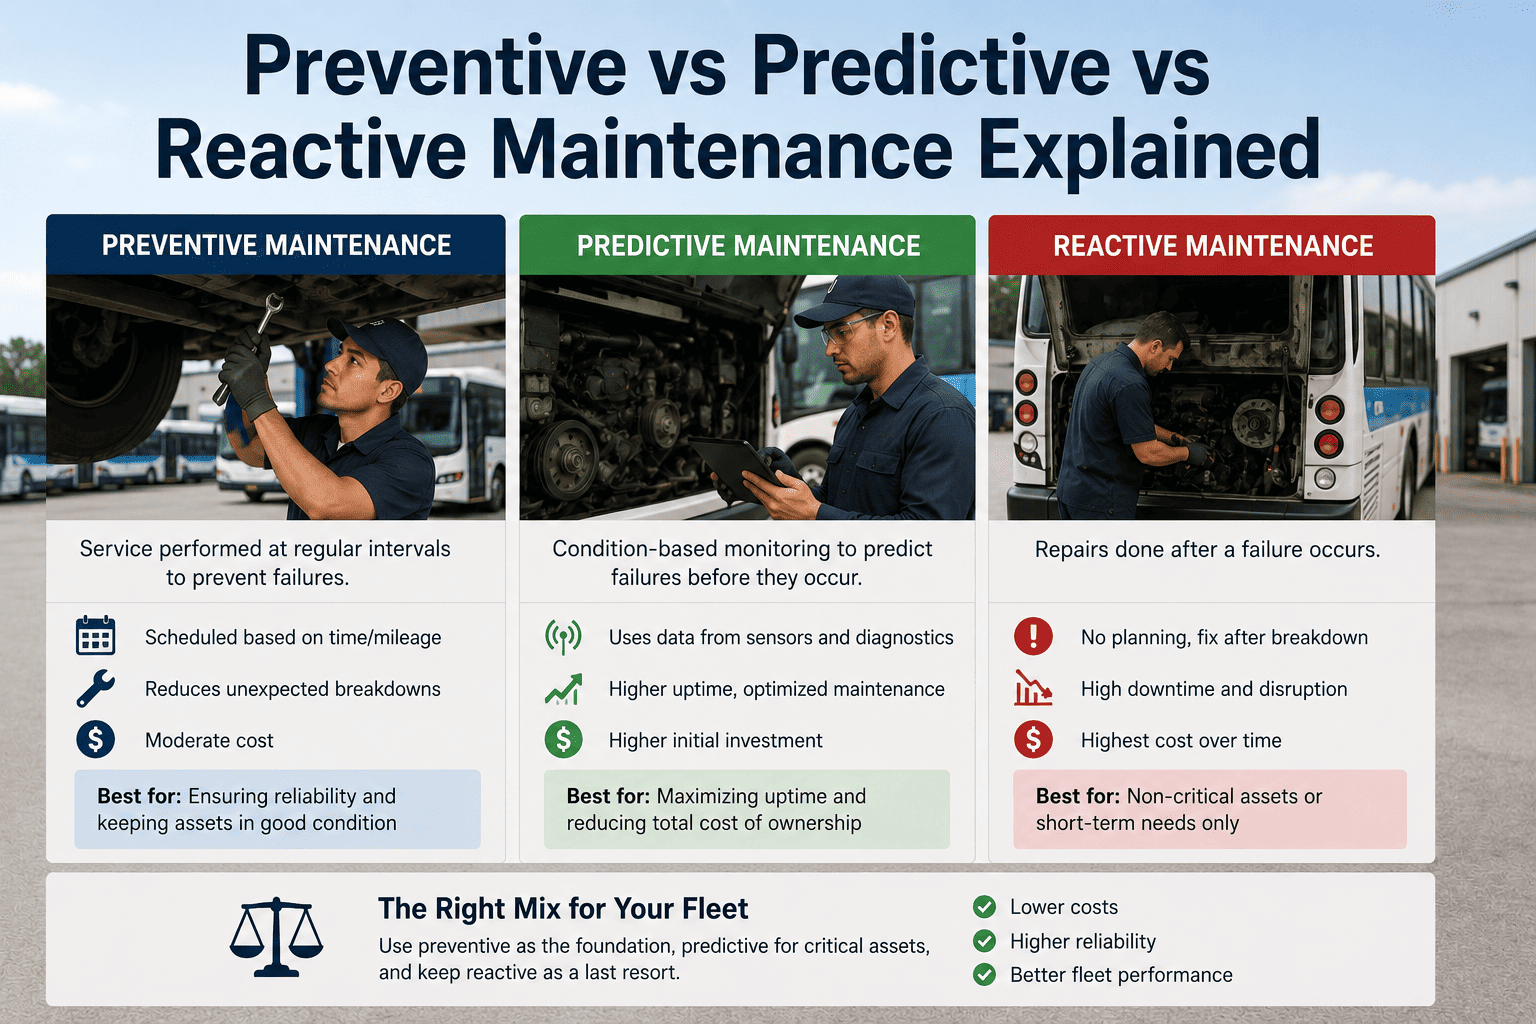
Three fundamentally different maintenance philosophies compete for resources, budget, and strategic alignment in every U.S. bus fleet. Reactive maintenance fixes problems after they occur—the "fix when it breaks" approach. Preventive maintenance schedules service intervals based on time, mileage, or engine hours—proactive but not predictive. Predictive maintenance uses real-time data, sensors, and condition monitoring to forecast failures before they happen—the ultimate optimization. Understanding the strategic differences between these three approaches, the financial trade-offs, and the operational contexts where each excels is essential for modern fleet management. Most leading U.S. fleets don't choose one strategy exclusively; instead, they blend all three into a hybrid approach optimized for their specific operating environment, risk tolerance, and capital availability. This comprehensive guide compares all three maintenance strategies, explains when to use each, provides detailed financial analysis of costs and benefits, and teaches you how to build a hybrid maintenance strategy that maximizes uptime while minimizing total cost.
Three strategies, vastly different costs. Compare preventive, predictive, and reactive maintenance and build the right mix for your bus fleet's risk profile and budget.
Reactive maintenance is the oldest maintenance philosophy: operate vehicles until something fails, then repair the failure. No preventive schedules, no condition monitoring, no planned downtime. You run your buses for $80,000–150,000 in revenue per vehicle per year, extract every drop of value, and pay for repairs only when absolutely necessary.
Apparent Advantages: Reactive maintenance appears cheap upfront. You're not spending money on preventive service that hasn't been triggered yet. You're not maintaining assets that might not fail for years. A fleet operator running reactive maintenance incurs only explicit, reactive costs: $2,500 for an emergency transmission repair, $800 for unexpected brake pads, $3,200 for a towing invoice. These are real invoices for real problems that exist.
Hidden Costs—The Real Story: Reactive maintenance is economically catastrophic because it moves all maintenance cost to the expensive pathway. When a component fails unexpectedly mid-route: 1. Emergency towing/roadside repair: $1,500–3,500 2. Emergency labor (overtime rates): $1,200–2,800 3. Parts (purchased in panic, not bulk-ordered): 20–40% markup vs. planned purchase = $800–2,000 extra cost 4. Lost revenue (bus out of service 3–7 days during repair cycle): $8,000–15,000 5. Cascade failures (a transmission failure puts stress on engine, cooling system, electrical): $5,000–12,000 in secondary repairs A component that would cost $400 to replace during preventive maintenance costs $15,000–25,000 when it fails as an emergency. The "savings" from skipping preventive maintenance are illusory; you're simply moving costs to more expensive channels.
Uptime and Safety Consequences: A fleet operating reactively averages 35–50% uptime on aging fleets. Half the fleet is broken down at any given time. This creates immediate crises: school buses don't arrive to pick up students, transit buses miss schedules, charter passengers are stranded. Insurance and liability exposure increases because vehicles operating with deferred maintenance are legally riskier than properly serviced vehicles.
Who Operates Reactively? Startup fleets without capital, very small operators (3–5 buses) without management infrastructure, or distressed fleets in survival mode (debt-loaded, cash-strapped). Reactive maintenance is chosen out of necessity, not strategy. No professionally-managed fleet in the United States chooses reactive maintenance if alternatives are financially viable.
Transition from reactive to preventive – see Bus CMMS solution
Preventive maintenance schedules service intervals—typically in months, miles, or engine hours—and performs service regardless of component condition. An oil change is performed every 20,000 miles OR 12 months, whichever comes first, whether the oil analysis shows contamination or not. Brakes are inspected every 50,000 miles, whether they're visibly worn or still have 75% material remaining. Tires are rotated every 30,000 miles per manufacturer spec.
The Philosophy: Preventive maintenance assumes that waiting for visible failure is too risky. Components have predictable wear patterns; service them before they fail, and you prevent catastrophic breakdowns. The cost of some wasted service (replacing components that had more life remaining) is offset by the prevention of expensive emergency repairs.
Implementation Approach: Most preventive maintenance is scheduled based on manufacturer specifications (Cummins, Volvo, Allison, Westport all publish detailed PM schedules). A fleet implements these schedules systematically, often using CMMS (Computerized Maintenance Management System) software to track due dates and generate work orders. Well-managed preventive maintenance requires:
(1) Accurate tracking: mileage, engine hours, calendar dates—so you know which services are actually due. (2) PM scheduling discipline: the shop must be capable of performing 95%+ of scheduled services on time. (3) Parts availability: parts must be stocked before service is due, not ordered after the fact. (4) Crew training: technicians must understand the procedures and execute them correctly.
Financial Impact: Preventive maintenance typically costs $13,000–16,000 per bus annually on a well-managed operation. This includes all planned service, labor, and parts. Some preventive service is "wasted"—you replace a component before failure, and it could have lasted longer. But this waste is far cheaper than the cost of emergency breakdowns. Fleet uptime typically reaches 82–88% with preventive maintenance, up from 35–50% with reactive. Annual unplanned maintenance cost drops to $3,000–5,000 per bus (vs. $15,000+ with reactive).
Best For: School districts (safety-critical, budget-constrained), public transit agencies (need reliability for passengers), and professional charter/tour operators (reputation-dependent). Preventive maintenance is the minimum acceptable standard recommended by the American Bus Association, FMCSA, and all major fleet management best-practice guides.
Predictive maintenance uses real-time data—sensors, condition monitoring, telematics, and analytics—to forecast component failures before they happen. Instead of servicing based on time/mileage/hours, predictive systems measure actual condition and predict when failure will occur. Service is scheduled only when data indicates failure is imminent, not before.
Example: Oil Change via Predictive PM A preventive approach: oil change every 20,000 miles OR 12 months. Predictive approach: oil change when oil analysis shows viscosity loss exceeding 10% OR metal particle count exceeds 150 ppm (parts per million), whichever comes first. A fleet operating primarily on highways with minimal city driving might extend oil changes from 20,000 miles to 25,000 miles because condition data shows oil is still healthy. A fleet with high-idle city buses might reduce intervals to 15,000 miles because condition data shows accelerated degradation.
Technology Requirements: Predictive maintenance requires data collection infrastructure: OBD-II sensors (engine diagnostics), battery voltage/temperature monitoring, brake pad thickness sensors, oil analysis (sampling and laboratory testing), thermal imaging (detecting hot spots in electrical systems), and telematics platforms (collecting, storing, analyzing all this data). For a 45-bus fleet, predictive infrastructure might cost $60,000–120,000 upfront plus $2,000–3,000 monthly for data services and analysis.
Financial Impact: Predictive maintenance typically costs $15,000–18,000 per bus annually—higher than preventive because of sensor and data costs. But the higher cost delivers benefits: (1) Elimination of wasted service (15–25% fewer unnecessary services), (2) Extended component life (run components closer to failure limits), (3) Early warning of developing problems (fix brake wear at 75% before it becomes an emergency), (4) Reduced emergency breakdowns (85–90% reduction vs. 70% with preventive).
The ROI is strongest on high-utilization, high-failure-rate components: brakes (expensive to replace mid-route), batteries (critical on electric buses), and transmissions (catastrophic failure cost is $15,000–25,000). A fleet might use preventive maintenance as the baseline but add predictive elements on these high-failure components. This hybrid approach captures most benefits of predictive while avoiding full-infrastructure costs.
Best For: High-utilization transit fleets (24/7 operation, downtime very costly), fleets operating in extreme climates (cold, heat, salt exposure accelerate component wear), safety-critical operations (school buses with zero-tolerance for brake failure), and premium operators where reliability is a competitive advantage.
Leverage predictive analytics – see Bus CMMS predictive maintenance features
Comparing reactive, preventive, and predictive maintenance across multiple dimensions reveals the strategic trade-offs and appropriate contexts for each approach.
Total Cost of Ownership (TCO): A 45-bus fleet operating over five years accumulates significant costs across the three strategies. Reactive maintenance ($21,500/bus/year × 45 buses × 5 years = $4,837,500 total fleet cost). Preventive maintenance ($14,200/bus/year × 45 × 5 = $3,195,000 total). Predictive maintenance ($15,800/bus/year × 45 × 5 = $3,555,000 total). While predictive has higher annual cost, it reduces catastrophic failures, extends bus lifespan by 2–3 years, and improves resale value—offsetting the higher annual cost.
Uptime and Revenue Impact: Reactive: 35–50% uptime = 667–900 bus-days/month operational on a 45-bus fleet at 30 days/month. At $279/bus-day average revenue, this is $186,000–251,000 monthly revenue. Preventive: 82–88% uptime = 1,107–1,188 bus-days/month. Revenue: $309,000–331,000 monthly. Predictive: 90–94% uptime = 1,215–1,269 bus-days/month. Revenue: $339,000–354,000 monthly. The operational benefit of moving from reactive to preventive is $58,000–145,000 monthly (or $696,000–1,740,000 annually). Moving from preventive to predictive adds another $30,000–46,000 monthly ($360,000–552,000 annually).
Capital Requirements: Reactive: minimal upfront (just buy buses). Preventive: moderate (CMMS software $5,000–15,000 annually, some telematics integration $25,000–50,000). Predictive: high (sensor infrastructure $60,000–120,000, data platform $2,000–3,000/month = $24,000–36,000 annually).
Staffing and Expertise: Reactive: minimal staff, basic troubleshooting skills. Preventive: dedicated maintenance manager, technicians trained on PM procedures, shop discipline. Predictive: data analysts, condition-monitoring expertise, advanced diagnostic skills. Predictive is harder to staff; not all technicians can interpret oil analysis or thermal imaging.
Build your hybrid maintenance strategy – see Bus CMMS implementation
The most sophisticated U.S. bus operators don't choose a single maintenance strategy exclusively. Instead, they implement a hybrid approach: preventive maintenance as the foundation (all buses, all service types), with predictive elements overlaid on high-risk, high-failure-rate components.
Hybrid Model Example: 45-Bus Fleet All buses follow a preventive schedule: oil changes at 20,000 miles, transmission service at 100,000 miles, brake inspections every 50,000 miles. But high-failure components get predictive augmentation: (1) Brakes: add ultrasonic sensors to measure pad thickness in real-time. If data shows wear rate is 20% faster than historical average, tighten the inspection interval. (2) Batteries (electric buses): add voltage/temperature monitoring. If battery capacity is declining faster than normal, schedule diagnostic service before range becomes unacceptable. (3) Transmissions: add pressure/temperature monitoring. If data shows transmission fluid is overheating, investigate for internal leaks before failure.
The cost of this hybrid approach is 80–90% of pure preventive (minimal added sensors for high-failure components), but the uptime improvement is 95% of pure predictive (catching most critical failures before they cascade). This is the "best bang for buck" approach: you get 90% of the uptime benefit for 90% less cost.
Financial Justification for Hybrid: Adding predictive elements to brakes and batteries on a 45-bus fleet might cost $30,000 upfront (sensors) plus $8,000 annually (monitoring service). First-year cost: $38,000. Expected benefit: 2–3 fewer brake failures/battery failures per year, each preventing 1–2 weeks of downtime. Value per prevented failure: $12,000–18,000 (recovery of lost revenue plus prevented secondary damage). Payback: 2–3 years. Year 2+ is pure benefit.
Implement hybrid PM strategy – see Bus CMMS predictive capabilities
We started with reactive maintenance because we were underfunded. We were bleeding money—constant emergency repairs, buses sitting idle, safety concerns. Three years ago, we implemented preventive PM with Bus CMMS. First-year savings: $280,000. Uptime jumped from 48% to 85%. A year later, we added predictive battery monitoring to our electric buses. Now we predict battery failures before they happen. Zero roadside breakdowns from battery issues. Every dollar we spend on predictive gives us $4 back in prevented emergency repairs. The hybrid approach is the sweet spot for fleet profitability and reliability.
How do I know which maintenance strategy is right for my fleet?
Start with preventive maintenance if you have 15+ buses and any professional management structure. Add predictive elements on high-failure components if you operate high-utilization routes or have safety-critical missions. Choose reactive only if you're in survival mode with <5 buses. Most mid-size fleets benefit from hybrid (preventive + predictive on 2–3 critical components).
Can I transition from reactive to preventive without a major disruption?
Yes, in a phased 90-day transition. Phase 1 (30 days): audit current maintenance, design PM schedules. Phase 2 (30 days): pilot PM on 8–10 buses. Phase 3 (30 days): rollout to full fleet. Most fleets manage the transition with no operational disruption; just discipline and planning required.
Is the uptime gain from preventive to predictive worth the extra cost?
It depends on your utilization and failure profile. For high-utilization fleets (>20,000 miles/bus/year) operating in harsh conditions, the 6–12% uptime gain from preventive (85%) to predictive (91–97%) translates to $150,000–300,000 in extra annual revenue, which easily justifies the added cost. For lightly-utilized fleets (<10,000 miles/year), the gain is marginal and not worth the investment.
What if I can't afford predictive maintenance infrastructure?
Implement preventive maintenance first and add predictive elements incrementally. Start with oil analysis (cheap condition monitoring: $30/sample, gives huge insights). Add brake sensors next (high failure rate). Build toward full predictive infrastructure over 3–5 years as cash flow allows. Hybrid approach delivers 90% of benefits for 80% of cost.
Does preventive maintenance require expensive CMMS software?
Theoretically you can use spreadsheets for <30 buses, but it fails at scale. A CMMS like Bus CMMS ($8–18/bus/month) is ROI-positive at 15+ buses because it eliminates human error and scales reliably. First-year cost is recovered through reduced breakdowns and eliminated wasted service within 3–6 months.
How often should I review and adjust my maintenance strategy?
Quarterly in year 1 (as you collect real-world failure data and adjust). Annually thereafter. Accumulating data reveals which components fail most frequently on YOUR fleet in YOUR operating environment. Tailor your preventive/predictive mix accordingly based on actual experience, not generic industry data.
Can I mix maintenance strategies across my fleet (reactive on old buses, preventive on new)?
Operationally possible but organizationally messy. You'd need separate PM schedules, parts systems, and dispatch logic. Most fleets find it easier to standardize on one strategy (e.g., preventive for all) and adjust the schedule's aggressiveness per vehicle age. Old buses might have 6-month service intervals; new buses 12-month intervals. Same strategy, different parameters.
What's the relationship between maintenance strategy and insurance/compliance?
Insurance companies offer lower rates for preventive maintenance fleets (better safety profile, lower failure rate = lower claims). FMCSA and state DOTs expect preventive PM documentation in audits. Operating reactively increases audit risk and insurance rates. Predictive maintenance is a competitive advantage but not required for compliance.
The American Bus Association, FMCSA, and every major transit agency in the United States recommend preventive maintenance as the minimum standard for professional bus fleet operations. Reactive maintenance is economically indefensible at any scale above 5 buses. Predictive maintenance is the premium strategy, delivering maximum uptime and lowest total cost, but it requires infrastructure investment and specialized expertise. The hybrid approach—preventive baseline + predictive on high-risk components—offers the best strategic balance: 90% of predictive benefits with 80% of the cost. Choose your strategy based on utilization, operating environment, safety sensitivity, and capital availability. But choose preventive at minimum. Reactive maintenance is not a strategy; it's a crisis management mode.


