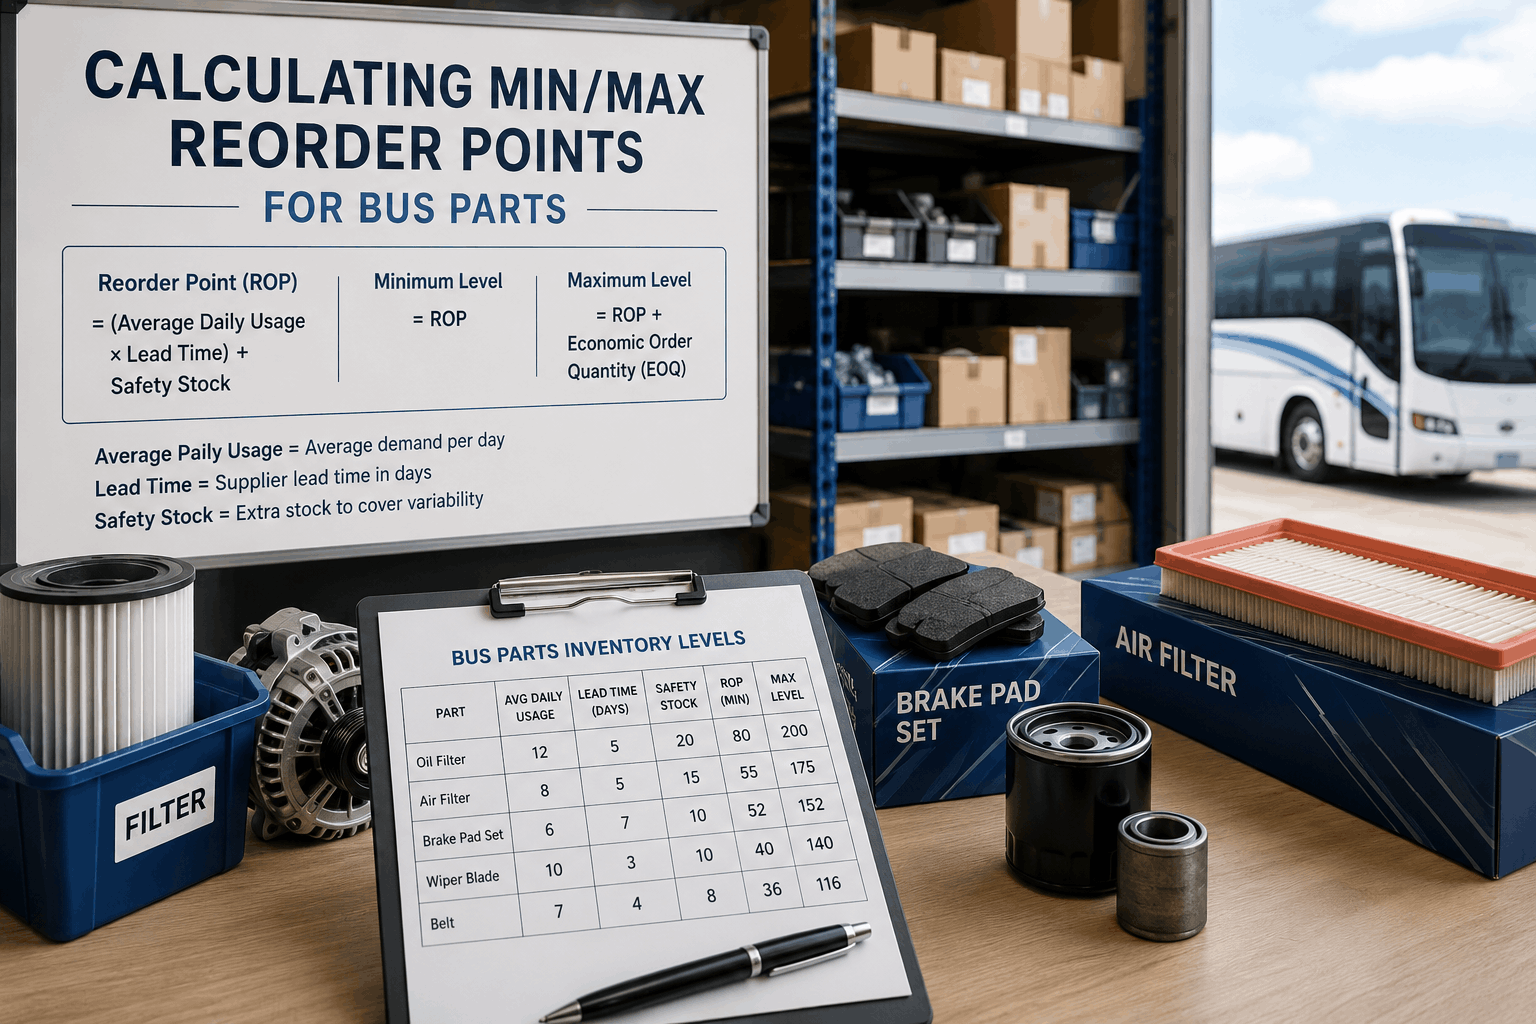
A 200-bus transit fleet in Colorado had a parts room with 4,500 different line items. The problem wasn't the number of parts — it was the logic (or lack of logic) behind what they stocked and how much. Brake pads for 2018-2022 buses? Always out of stock. Mechanics paid rush shipping weekly. Air filters for 2023 buses? They had 400 in stock — a 3-year supply. Oil filters for a retired bus model? Still on the shelf, untouched for 4 years. The fleet was spending $420,000 annually on parts, with 28% tied up in dead stock while simultaneously paying for emergency orders. The solution wasn't buying more parts — it was calculating the right min/max and reorder points for every part. This guide covers the formulas, the logic, and how to set inventory levels that prevent stockouts without wasting cash.
Inventory Optimization 2026
28%
of Parts Inventory Is Dead Stock
Average fleet has 28% of parts that haven't moved in 12+ months — cash that should be freed up.
3-5x
Rush shipping markup over standard
20-35%
Inventory reduction achievable
3-6 mo
Payback on inventory software
Why Min/Max and Reorder Points Matter for Bus Fleets
Bus fleets manage thousands of parts with different usage patterns. An oil filter used daily needs different inventory logic than an alternator used quarterly. Without min/max and reorder point formulas, fleets fall into two traps: overstock (cash tied up in parts that may never be used) and stockouts (work stops because critical parts aren't available). Min/max inventory management sets a minimum quantity (trigger to reorder) and maximum quantity (upper limit to avoid overstock). Reorder point is the inventory level at which you place a new order. The formulas below use historical usage data, vendor lead times, and safety stock to calculate the optimal levels for each part.
Min
Minimum Stock Level (Reorder Point)
The inventory level that triggers a reorder. Calculated as: (Average daily usage × Lead time in days) + Safety stock. When stock drops to this level, you place an order for the reorder quantity.
BusCMMS: Auto-calculates min levels from usage history
Max
Maximum Stock Level
The upper limit of inventory for a part. Calculated as: Reorder point + Reorder quantity. Prevents overstocking and ties up less cash. Typical max is 60-90 days of supply for fast-moving parts.
BusCMMS: Max levels configurable per part
Safety
Safety Stock
Extra inventory to protect against demand spikes or supplier delays. Calculated as: (Average daily usage × Supplier variance days) + (Demand variability factor). Typical safety stock adds 20-50% to reorder point.
When inventory drops to 12 filters, place an order. The order quantity should cover usage during lead time plus replenishment period (typically 2-4 weeks of supply).
Real Fleet Example: Oil Filter Reorder Point
A 100-bus fleet uses 12 oil filters per week (average). Supplier lead time is 5 business days. Safety stock set at 3 days. Daily usage = 2.4 filters. Reorder point = (2.4 × 5) + (2.4 × 3) = 12 + 7.2 = 20 filters. When stock reaches 20, order 60 filters (2-3 week supply). Before using this formula, they were ordering 200 filters whenever they remembered — and running out anyway.
How to Calculate Safety Stock
Safety stock protects against two uncertainties: demand spikes and supplier delays. Higher safety stock = fewer stockouts. Lower safety stock = less cash tied up. Calculate safety stock using this formula.
Basic Safety Stock Formula
Safety Stock = (Maximum daily usage × Maximum lead time) − (Average daily usage × Average lead time). For parts with stable demand and reliable suppliers, this is sufficient.
Service Level Safety Stock
Safety Stock = Z-score × Standard deviation of lead time demand. Use Z = 1.65 for 95% service level, Z = 1.96 for 97.5%, Z = 2.33 for 99%. Higher service level = more safety stock.
Bus Fleet Safety Stock Guidelines
Fast-moving parts (oil filters, air filters, bulbs): 20-30% safety stock. Critical parts (brake chambers, alternators, starters): 50-100% safety stock. Slow-moving parts: 0-10% safety stock or just-in-time ordering.
EOQ balances ordering costs against carrying costs to find the most cost-effective order quantity. The formula calculates the order size that minimizes total inventory costs.
Economic Order Quantity (EOQ) Formula & Example
FactorValueSource
Annual demand (D)600 oil filtersAnnual usage from parts history
Order cost (S)$25 per orderStaff time + processing + shipping
Annual carrying cost per unit (H)$2.40 per filter20% of unit cost × $12 filter = $2.40
Order 112 filters per order (approximately every 2 months). Fewer orders = lower ordering costs. Larger orders = higher carrying costs. EOQ finds the balance.
ABC analysis categorizes parts by annual usage value to prioritize inventory management effort.
A Items (10% of parts, 70-80% of value)
Tires, brake components (pads, rotors, chambers), transmissions, major assemblies. High value, high impact. Tight control, frequent review, accurate records. Reorder point managed daily. Cycle count weekly.
B Items (20% of parts, 15-20% of value)
Belts, hoses, sensors, alternators, starters. Medium value. Moderate control. Reorder point managed weekly. Cycle count monthly.
C Items (70% of parts, 5-10% of value)
Bolts, nuts, clips, bulbs, fuses, small hardware. Low value per unit. Loose control. Use min/max with higher safety stock. Cycle count quarterly.
Even with good intentions, fleets make predictable inventory errors. Here's how to identify and correct them.
Mistake
Ordering Too Much "Just in Case"
Result: Dead stock, cash tied up. Fix: Use EOQ and min/max with safety stock. Never order more than 90 days of supply except for parts with long lead times. Review slow-moving parts quarterly.
Mistake
Ignoring Lead Time Changes
Result: Stockouts when suppliers get slower. Fix: Recalculate reorder points whenever lead time changes by more than 20%. Track supplier lead times in your inventory system.
Mistake
Not Removing Obsolete Parts
Result: 28% of inventory value dead stock. Fix: Run usage report every 6 months. Parts with zero usage in 12 months: remove from stock. Parts with zero usage in 24 months: dispose or return.
Mistake
Manual Reordering
Result: Missed orders, duplicate orders, inconsistent quantities. Fix: Use auto-reorder functionality in inventory software. Set reorder points once, let system generate purchase orders.
Stop Guessing. Start Calculating.
Min/max, reorder points, safety stock, EOQ, and ABC analysis — all calculated automatically. Free 14-day trial.
Reorder point = (Average daily usage × Lead time in days) + Safety stock. Example: 2 filters/day × 5 days lead time + 5 filters safety stock = 15 filter reorder point.
How much safety stock should I keep for bus parts?
Fast-moving consumables: 20-30% of reorder point. Critical safety parts: 50-100%. Slow-moving parts: 0-10% or just-in-time ordering. Safety stock balances stockout risk vs carrying cost.
What is min/max inventory management?
Min/Max sets a minimum quantity (trigger to reorder) and maximum quantity (upper limit to avoid overstock). When stock hits minimum, order enough to reach maximum. Simple and effective.
How often should I recalculate reorder points?
Review quarterly for A items (high value), semi-annually for B items, annually for C items. Recalculate immediately when usage patterns or supplier lead times change significantly.
Can BusCMMS calculate reorder points automatically?
Yes. BusCMMS analyzes your parts usage history, calculates average daily usage, factors in supplier lead times, and generates recommended min/max and reorder points automatically.
What is dead stock in bus parts inventory?
Dead stock is parts that haven't been used in 12+ months. Average fleet has 28% dead stock. Remove it to free up cash and shelf space. Reorder point formulas prevent future dead stock.
Every Part. Every Reorder Point. Calculated.
Automated min/max, reorder points, safety stock, EOQ, and ABC analysis. Stop stockouts. Free up cash. Free 14-day trial.