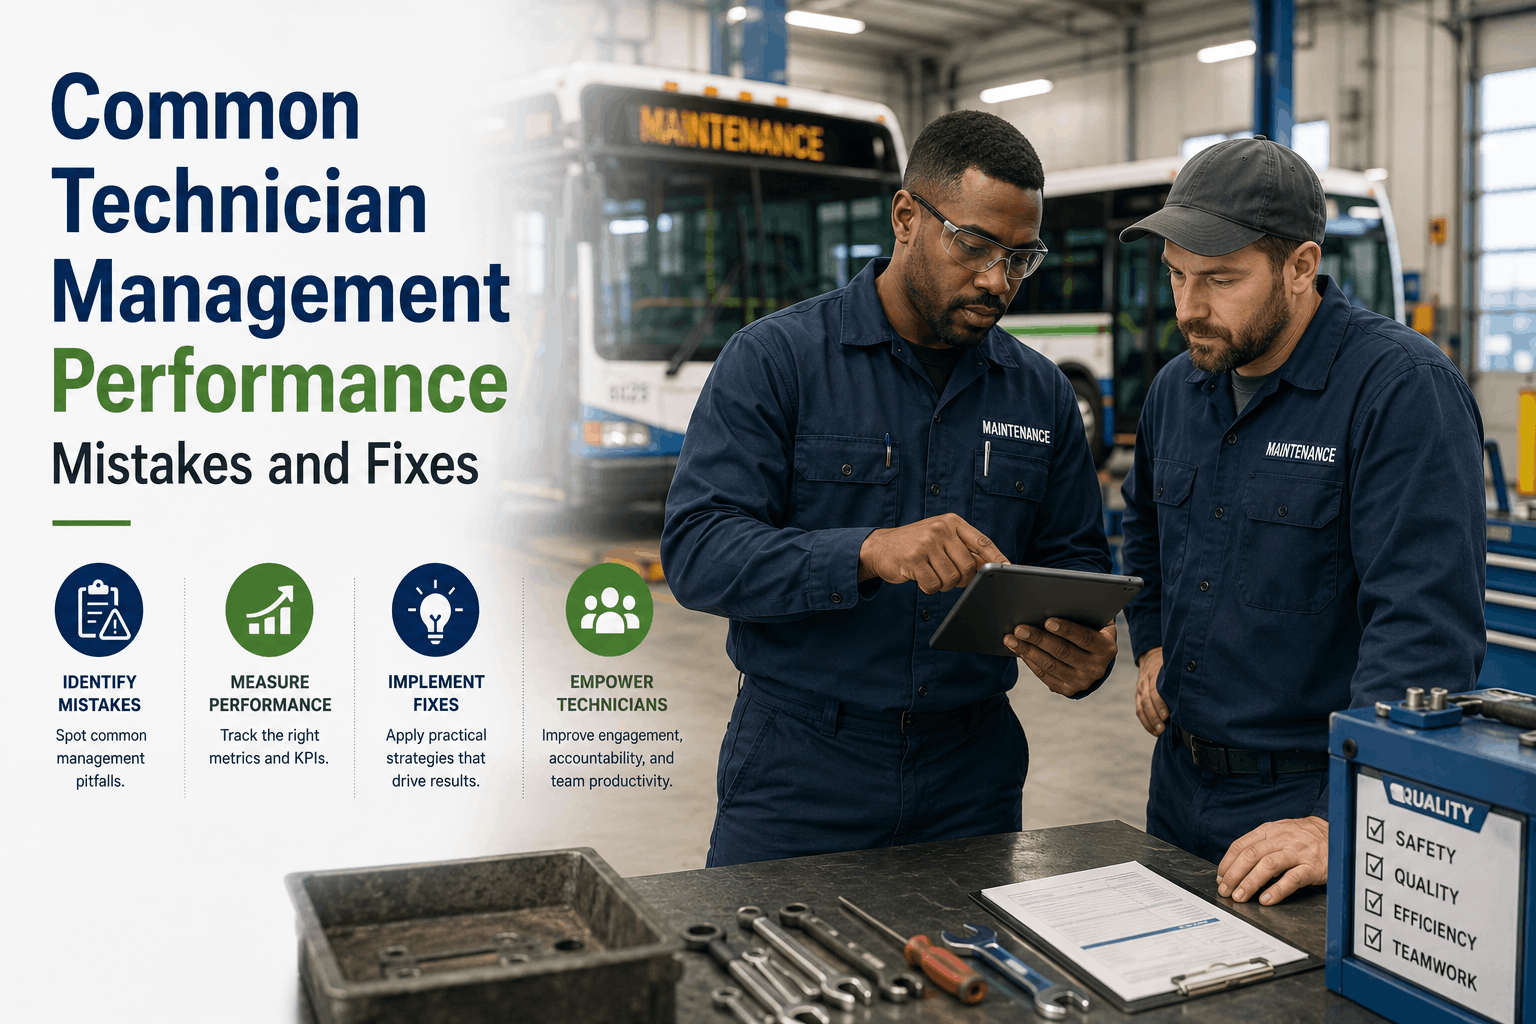
Your technicians are your most valuable maintenance asset. A skilled mechanic can diagnose and repair a bus in hours. An unorganized or undertrained team can let the same bus sit for days. Yet most fleet managers focus entirely on vehicles and parts — ignoring the human side of maintenance. They track bus uptime but not technician productivity. They measure parts inventory turns but not mechanic training hours. The result: frustrated technicians, inconsistent repair quality, high turnover, and hidden labor costs. This guide explores the most common technician management performance mistakes — and provides actionable fixes backed by real-world fleet examples. From unclear work assignments to inadequate training to poor feedback loops, learn how to optimize your technician team and lower operating costs.
Technician Management
Common Technician Management Performance Mistakes and Fixes
Explore strategies, benchmarks, and real-world examples that help organizations optimize technician management performance and lower operating costs.
Mistake 1: No Clear Visibility into Technician Workload
When managers don't know which technicians are overloaded and which have capacity, work piles up unevenly. Some technicians burn out. Others sit idle. Repairs take longer than necessary. Without workload visibility, you cannot optimize labor allocation or predict completion dates. The fix: implement digital work order assignment with real-time status tracking. Your CMMS should show every technician's open work orders, estimated hours remaining, and completed work for the day. Review workload distribution daily. Reassign work when imbalances appear. Use capacity planning reports to anticipate peak demand before it creates bottlenecks. Fleets that implement workload visibility typically increase work order throughput by 20-35% without adding headcount.
Signs of Workload Imbalance
Same technicians always working overtime. Others always leaving early. Work orders aging unevenly. Complaints about unfair assignment. High turnover among overloaded technicians.
Fix: Workload Dashboard
Implement a real-time dashboard showing open work orders per technician, estimated hours, and completion percentages. Review daily at shift start. Reassign as needed.
Mistake 2: Inconsistent Repair Quality and Repeat Defects
A bus returns to service with a repaired brake issue. Two weeks later, the same defect reappears. The driver reports it again. The bus returns to the shop. The technician replaces the same part again. This cycle wastes labor, parts, and trust. Repeat defects indicate poor root cause diagnosis, incomplete repairs, or lack of quality control. The fix: track repeat defects by technician, by component, and by bus. When the same defect recurs within 30 days, flag it for root cause analysis. Investigate whether the technician missed a secondary failure, used incorrect parts, or lacked proper training. Use repeat defect data to identify training needs and adjust quality assurance processes. Fleets that reduce repeat defects by 50% save thousands in rework labor and parts.
Common Repeat Defect Causes
Missed secondary failure (replaced pad but not rotor). Incorrect part (wrong specification). Improper torque or adjustment. Incomplete diagnostic (fixed symptom, not root cause).
Fix: Root Cause Analysis
Flag any repeat defect within 30 days. Assign senior technician to investigate. Document findings. Update repair procedures. Provide targeted training.
Mistake 3: Untracked Technician Productivity and Efficiency
If you don't measure technician productivity, you cannot improve it. Yet many fleets track vehicle uptime religiously while having no idea which technicians are high performers and which need support. The result: top performers carry the team while struggling technicians go unnoticed. The fix: track Mean Time To Repair (MTTR) by technician, by repair type, and by component. Compare MTTR against shop average and historical baseline. Identify technicians who consistently take longer than peers. Investigate root causes: lack of training, missing tools, poor parts availability, or unclear work orders. Use data to coach, not punish. Celebrate technicians with consistently low MTTR and high quality. Fleets that track technician productivity improve labor efficiency by 15-30% within 12 months.
Productivity Metrics to Track
Mean Time To Repair (MTTR) by technician and repair type. Work orders completed per week. First-time fix rate. Overtime hours. Schedule compliance.
Fix: MTTR Tracking
Log actual repair time for every work order. Compare to estimated time. Identify technicians with consistently high variance. Provide training or process improvements.
The Analytics: Technician Performance Metrics That Matter
To manage technicians effectively, you need to track the right metrics. Here are the essential technician performance KPIs:
Metric: Mean Time To Repair (MTTR)
Average time from work order assignment to completion. Track by technician, by repair type, by component. Lower MTTR = higher efficiency. Investigate technicians with MTTR 30% above average.
Metric: First-Time Fix Rate
Percentage of repairs completed without repeat defect within 30 days. Target 95%+. Low first-time fix rate indicates diagnostic gaps, quality issues, or incomplete repairs.
Metric: Schedule Compliance
Percentage of work orders completed by scheduled due date. Track by technician. Low compliance may indicate unrealistic scheduling, capacity issues, or prioritization problems.
Metric: Utilization Rate
Percentage of paid hours spent on direct repair work. Target 75-85% for shop floor technicians. Low utilization indicates excessive downtime, waiting for parts, or administrative tasks.
Metric: Training Hours per Technician
Annual training hours completed. Target 40-80 hours per year for transit technicians, 20-40 hours for school bus technicians. Track certifications and expiration dates.
Metric: Overtime Percentage
Overtime hours ÷ total hours worked. High overtime (over 10-15%) may indicate understaffing, poor scheduling, or inefficient processes. Track by technician and by cause.
Mistake 4: No Structured Training or Career Pathways
Technicians who feel stuck leave. Without clear training paths and advancement opportunities, your best mechanics will find jobs elsewhere. The cost of replacing a skilled transit technician is $15,000-30,000 in recruiting, onboarding, and lost productivity. The fix: create structured training programs with clear milestones. Track training completion and certification expiration dates in your CMMS. Provide cross-training opportunities (brakes, engines, electrical, HVAC, EV systems). Create career ladders: apprentice → technician → senior technician → lead technician → supervisor. Recognize and reward skill advancement with title changes and pay increases. Fleets with structured career pathways retain technicians 2-3x longer than those without.
Training Gaps Signs
High MTTR for specific repair types. Repeat defects on same components. Technician requests for same information repeatedly. High turnover among newer technicians.
Fix: Training Tracking
Log every training session and certification in CMMS. Set expiration alerts. Require refresher training before certifications expire. Track training hours per technician annually.
"Our 80-bus school district had 35% annual technician turnover. We were constantly recruiting, training, and losing mechanics. We implemented technician performance tracking and discovered our most experienced technicians were overloaded with complex repairs while newer technicians handled only oil changes. No one was training the next generation. We created an apprenticeship program, assigned senior technicians as mentors, tracked training hours, and created clear promotion paths. Within 18 months, turnover dropped to 12%, MTTR improved 22%, and repeat defects fell 45%. The investment in technician management paid for itself in reduced recruiting costs alone."
— Fleet Maintenance Manager, 80-bus school district, Pennsylvania
The Playbook: Building a Technician Management Framework
Transform your technician management from reactive to proactive with these core steps:
1
Audit Current Technician Skills and Certifications
Create a skills matrix for every technician. Identify gaps between current capabilities and fleet needs (EV certification, HVAC, diagnostics, etc.). Prioritize training investments.
2
Implement Digital Work Order Assignment
Use CMMS to assign work orders based on technician skills, workload, and priority. Eliminate manual assignment delays and favoritism. Track completion times automatically.
3
Establish Weekly Technician Performance Reviews
Review MTTR, schedule compliance, and repeat defects weekly. Identify top performers and those needing support. Document coaching conversations.
4
Create Career Ladder and Recognition Program
Define clear advancement criteria (skills, certifications, years, performance). Recognize top performers monthly. Celebrate training completions publicly.
Optimize Your Technician Team Performance
Track MTTR, repeat defects, utilization, training hours, and schedule compliance — all in one CMMS platform. Free 14-day trial.
Frequently Asked Questions
What are the most common technician management mistakes?
No workload visibility, inconsistent repair quality (repeat defects), untracked productivity, no structured training, poor feedback loops, and unclear career pathways.
How do I measure technician productivity?
Track Mean Time To Repair (MTTR), work orders completed per week, first-time fix rate, schedule compliance, utilization rate, and overtime percentage. Compare to shop averages.
What is a good MTTR for a bus mechanic?
MTTR varies by repair type. Brake job: 2-4 hours. Engine diagnosis: 1-2 hours. Transmission replacement: 8-12 hours. Track by repair type, not overall average.
How do I reduce repeat defects?
Track repeat defects by technician and component. Investigate root causes. Provide targeted training. Update repair procedures. Implement quality checks on complex repairs.
How much technician training is recommended annually?
Transit technicians: 40-80 hours annually. School bus technicians: 20-40 hours annually. Include OEM training, EV certification, diagnostic software, and safety training.
Does BusCMMS include technician management features?
Yes. BusCMMS tracks MTTR by technician, repeat defects, training hours and certifications, workload distribution, schedule compliance, and utilization rates.
Technician Management — Complete Guide
Workload visibility, productivity tracking, repeat defect analysis, training management, career pathways. Everything fleets need to optimize technician performance.