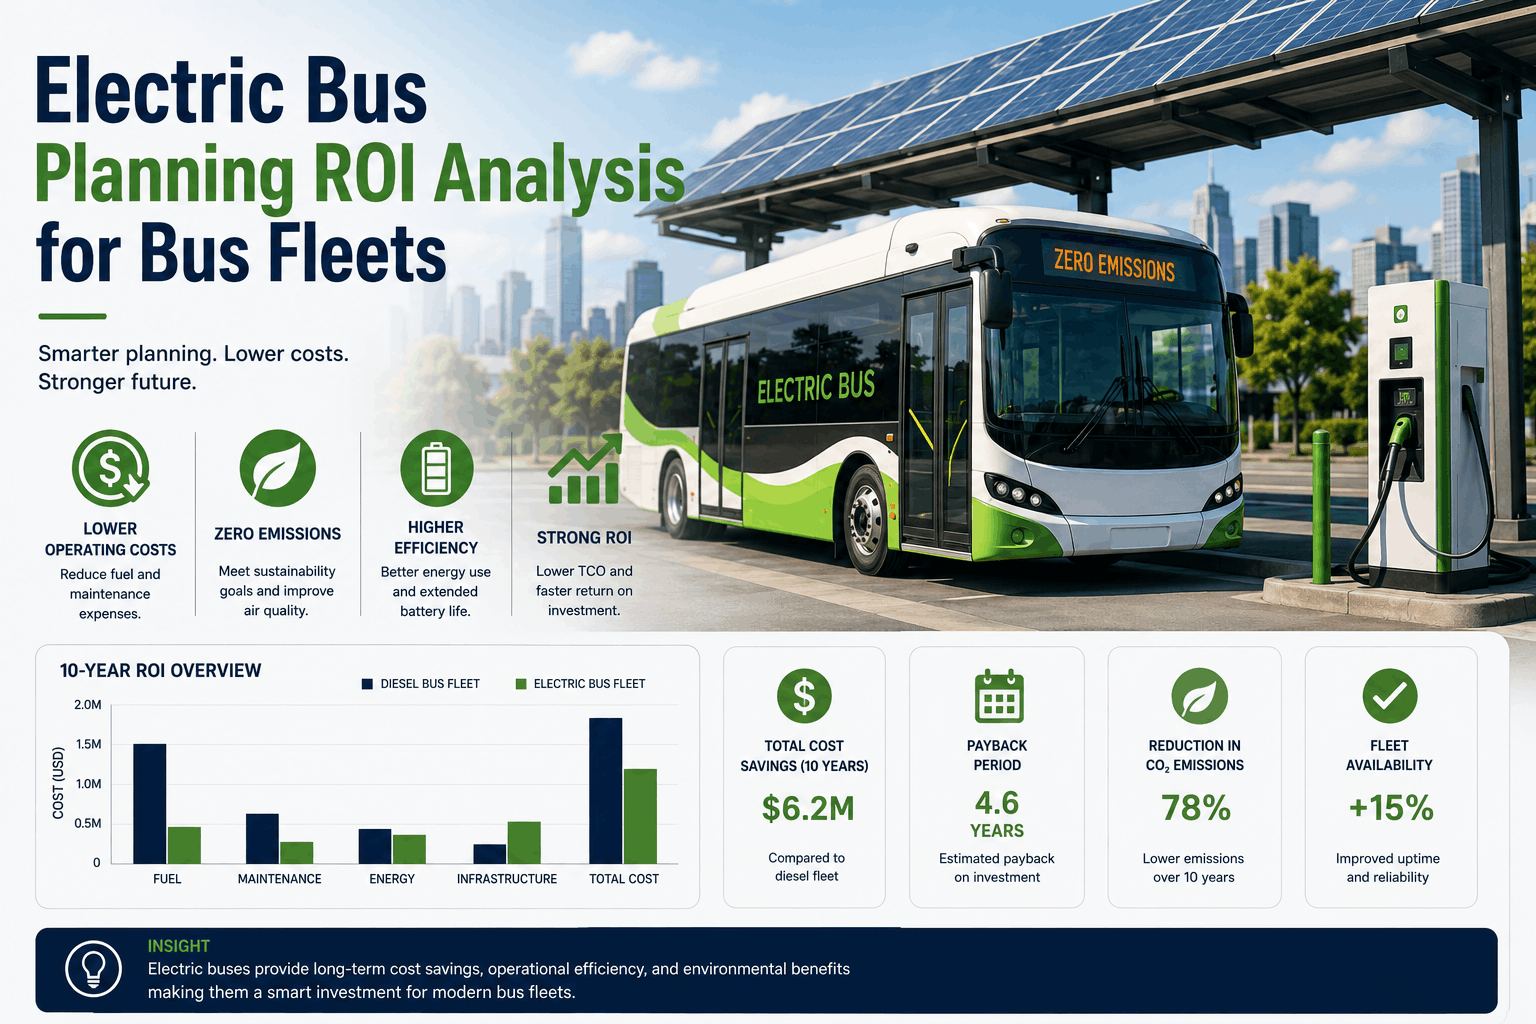
Electric buses are transforming transit and school bus fleets across North America. The EPA Clean School Bus Program has allocated $5 billion through 2026. State-level incentives add another $2-3 billion. But the purchase price gap remains: an electric bus costs $350,000-550,000 compared to $140,000-180,000 for diesel. Fleet managers need more than grant funding — they need a clear ROI analysis that accounts for fuel savings, maintenance reduction, infrastructure costs, battery replacement, and total cost of ownership over 12-15 years. This guide provides a framework for electric bus planning ROI analysis, including fuel cost comparisons, maintenance savings calculations, charging infrastructure costs, grant stacking strategies, and break-even mileage calculations. Use this analysis to build a business case for your fleet's electrification transition.
Electric Bus ROI 2026
Electric Bus Planning ROI Analysis for Bus Fleets
See how transit and school bus fleets use electric bus planning to improve compliance, efficiency, and vehicle availability.
Total Cost of Ownership: Electric vs Diesel
Total Cost of Ownership (TCO) is the only accurate way to compare electric and diesel buses. TCO includes purchase price, fuel/energy, maintenance, infrastructure, battery replacement, and residual value. The table below shows 12-year TCO for a typical 40-foot transit bus:
Electric Bus TCO (12 years)
Purchase price: $450,000 (after $150,000 incentives). Energy: $90,000 ($0.35/mile × 30,000 miles × 12 years × 70% electric). Maintenance: $36,000 ($3,000/year). Infrastructure: $15,000 (amortized charger cost). Battery replacement: $25,000 (year 10-12). Total TCO: $616,000.
Diesel Bus TCO (12 years)
Purchase price: $160,000 (no incentives). Fuel: $288,000 ($0.80/mile × 30,000 miles × 12 years). Maintenance: $84,000 ($7,000/year). Infrastructure: $0 (existing). Emissions aftertreatment: $12,000 (DPF, SCR). Total TCO: $544,000.
TCO Comparison
Diesel TCO: $544,000. Electric TCO: $616,000. Electric costs $72,000 more over 12 years ($6,000/year). However, with aggressive grant stacking, electric TCO can drop below diesel.
Breakeven Mileage
Electric breakeven occurs at 25,000-35,000 miles annually. School buses (12,000-15,000 miles/year) struggle to achieve payback. Transit buses (30,000-50,000 miles/year) achieve positive ROI.
Fuel and Energy Cost Comparison
Fuel is the largest variable operating cost for both diesel and electric buses. The comparison depends heavily on local fuel and electricity prices:
Diesel Fuel Cost per Mile
6 MPG school bus: $0.60-0.80 per mile. 4 MPG transit bus: $0.90-1.25 per mile. $4.00-5.00/gallon diesel. Annual cost (30,000 miles): $18,000-37,500 per bus.
Electric Energy Cost per Mile
2.2 kWh/mile average consumption. $0.12-0.18/kWh commercial rate = $0.26-0.40 per mile. With demand charges: $0.35-0.55 per mile. Annual cost (30,000 miles): $7,800-16,500 per bus.
Annual Fuel Savings (Electric vs Diesel)
School bus: $3,000-7,000 per bus annually. Transit bus: $8,000-15,000 per bus annually. 100-bus transit fleet saves $800,000-1,500,000 annually on fuel.
Electricity Price Sensitivity
$0.10/kWh: $0.22/mile. $0.14/kWh: $0.31/mile. $0.18/kWh: $0.40/mile. Demand charges add $0.08-0.15/mile without smart charging.
Maintenance Cost Comparison
Electric buses have significantly lower maintenance costs due to fewer moving parts. Here's the breakdown:
Diesel Bus Maintenance ($ per mile)
Oil and filters: $0.12-0.18. Transmission service: $0.05-0.08. DPF/SCR/DEF: $0.08-0.12. Brakes: $0.05-0.08. Belts/hoses/cooling: $0.05-0.07. Total: $0.50-0.65 per mile. Annual (30k miles): $15,000-19,500.
Electric Bus Maintenance ($ per mile)
Cabin air filter: $0.01-0.02. Coolant checks: $0.01-0.02. HV cable inspection: $0.01-0.02. Brake inspection (rare replacement): $0.02-0.03. Tires: $0.03-0.05. Battery SOH checks: $0.02-0.03. Total: $0.15-0.25 per mile. Annual (30k miles): $4,500-7,500.
Annual Maintenance Savings (Electric vs Diesel)
School bus: $4,000-8,000 per bus annually. Transit bus: $8,000-15,000 per bus annually. 100-bus transit fleet saves $800,000-1,500,000 annually on maintenance.
Combined Fuel + Maintenance Savings
School bus: $7,000-15,000 per bus annually. Transit bus: $16,000-30,000 per bus annually. 100-bus transit fleet saves $1.6-3.0 million annually.
Infrastructure and Battery Replacement Costs
Two major costs unique to electric buses: charging infrastructure and battery replacement. These must be included in any accurate ROI analysis:
Level 2 Charging Infrastructure (Overnight)
Charger cost: $5,000-10,000 per bus. Electrical panel upgrades: $200,000-500,000 for 25-50 buses. Site electrical engineering: $50,000-150,000. Total per bus (amortized): $5,000-15,000.
DC Fast Charging Infrastructure (Midday)
DCFC cost: $50,000-150,000 per charger (shared by 4-8 buses). Electrical upgrades: $500,000-2,000,000. Transformer upgrades often required. Total per bus: $15,000-40,000.
Battery Replacement Cost
LFP battery replacement at year 10-12: $15,000-30,000 per bus. Some manufacturers offer 12-year warranty on batteries (covers replacement). Without warranty, this is a significant TCO factor.
Smart Charging Software
Demand charge management software: $2,000-5,000 per charger annually. Reduces demand charges by 40-60%. Essential for cost-effective electric bus operation.
"Our 200-bus transit fleet analyzed electric bus ROI for three years before committing. We modeled fuel savings ($1.2M/year), maintenance savings ($1.1M/year), infrastructure cost ($3.5M one-time), and battery replacement ($2.5M at year 10). The 12-year TCO showed electric costing 8% more than diesel — until we stacked EPA grants ($6M), state incentives ($2M), and utility rebates ($1M). After incentives, electric TCO was 15% lower than diesel. The ROI analysis was essential for board approval. We're now ordering 50 electric buses with 7-year payback."
— Fleet Planning Director, 200-bus transit system, California
Grant and Incentive Stacking Strategy
The difference between positive and negative electric bus ROI often comes down to grant stacking. Combine these funding sources:
EPA Clean School Bus Program
Up to $345,000 per electric school bus. $5 billion allocated through 2026. Priority to low-income, rural, and tribal districts. Competitive grants and rebates available annually.
Low-No Grant Program (FTA)
Up to $1.5 million per electric transit bus. Covers bus purchase and charging infrastructure. Requires transit agency status. Highly competitive but significant funding.
State-Level Incentives
California HVIP: $150,000-200,000 per bus. New York: $100,000-150,000. New Jersey: $100,000-200,000. Massachusetts: $75,000-150,000. Colorado: $75,000-125,000. Check your state.
Utility Rebates and Incentives
Charging infrastructure rebates: $5,000-50,000 per charger. Demand charge reductions. Time-of-use rate discounts. Make-ready infrastructure funding. Engage utility early.
Calculate Your Fleet's Electric Bus ROI
Fuel savings, maintenance reduction, infrastructure costs, battery replacement, grant stacking — complete TCO analysis for electric bus transition. Free 14-day trial.
Frequently Asked Questions
What is the ROI for electric school buses?
School bus ROI varies by mileage. Low-mileage fleets (12,000 miles/year): 10-15 year payback. High-mileage fleets (20,000+ miles/year): 6-8 year payback. Grant funding significantly improves ROI.
How much do electric buses save on maintenance?
Electric buses save $4,000-8,000 annually per school bus and $8,000-15,000 annually per transit bus compared to diesel. No oil changes, no transmission, no exhaust system, brakes last 2-3x longer.
What is the payback period for electric transit buses?
Transit buses (30,000-50,000 miles/year) achieve payback in 4-7 years without grants, 2-4 years with grants. High mileage and high diesel prices accelerate payback.
How much does electric bus charging infrastructure cost?
Level 2 overnight charging: $5,000-15,000 per bus. DC fast charging: $15,000-40,000 per bus. Site electrical upgrades can add $200,000-2,000,000 depending on fleet size.
How long do electric bus batteries last?
Properly managed LFP batteries last 12-15 years. Capacity degrades to 70-75% at year 10. Most manufacturers offer 10-12 year battery warranties covering replacement if capacity drops below 70%.
Does BusCMMS support electric bus TCO tracking?
Yes. BusCMMS tracks energy consumption per mile, maintenance costs per electric bus, battery SOH checks, charger maintenance, and calculates electric bus TCO compared to diesel.
Electric Bus Planning ROI Analysis — Complete Guide
TCO comparison, fuel savings, maintenance reduction, infrastructure costs, battery replacement, grant stacking strategies. Everything fleets need for electric bus ROI analysis.