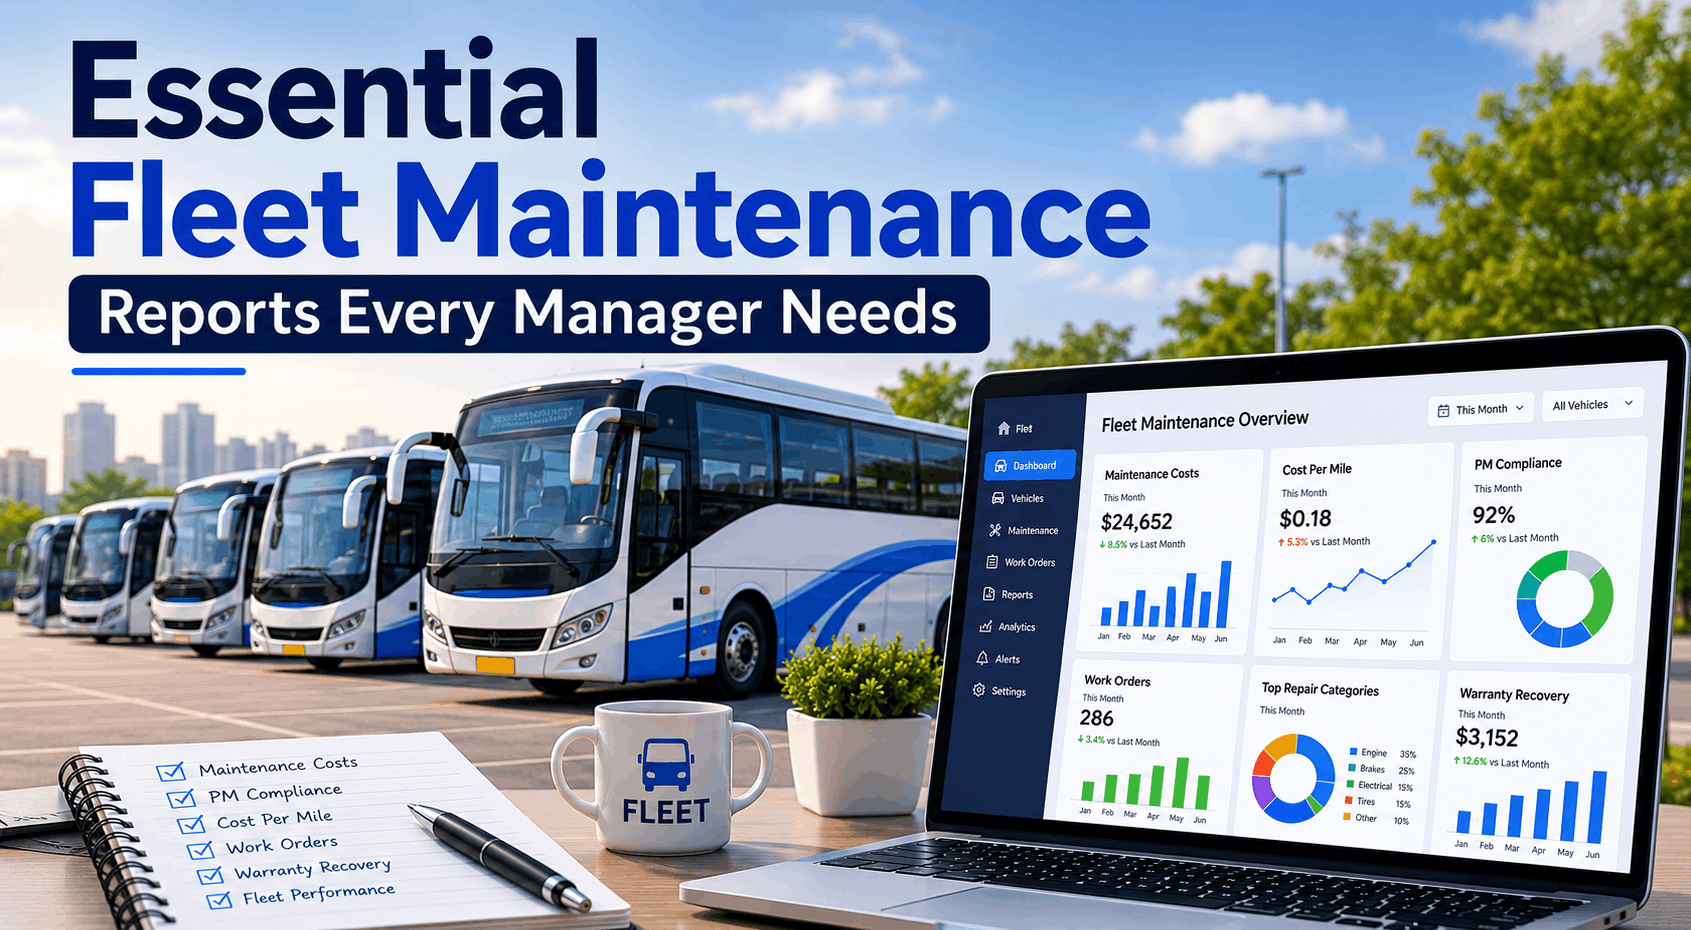
Essential Fleet Maintenance Reports Every Manager Needs
A 120-bus transit fleet in Washington generated 47 different reports every month. Spreadsheets, printouts, database exports. The maintenance manager spent 12 hours each month compiling, formatting, and distributing reports. But when the CEO asked "What's our most unreliable bus?" the manager couldn't answer. When the finance director asked "Why is maintenance cost per mile rising?" there was no data. When the safety officer asked "Which violations are recurring?" the answer was a guess. The problem wasn't lack of reports — it was too many reports with no actionable insights. Most maintenance reports are noise, not signal. This guide identifies the essential fleet maintenance reports that actually drive decisions: cost per mile, PM compliance, breakdown analysis, parts usage, labor efficiency, and warranty recovery. Stop generating reports. Start making decisions.
Maintenance Reporting 2026
12 hrs
Weekly Reporting Time → 30 Minutes
Essential reports cut reporting time by 95% while improving decision-making.
6
Essential reports only
$0.50
Cost per mile target
95%
PM compliance target
The 6 Essential Fleet Maintenance Reports
These six reports provide the insights you need to manage your fleet effectively. Generate them weekly or monthly. Act on what they tell you.
1
Cost Per Mile Report
Total operating cost divided by miles driven. Track by bus, by route, by month. Flag outliers above fleet average. Identify cost trends before they become problems.
BusCMMS: Real-time cost per mile by bus
2
PM Compliance Report
Percentage of scheduled preventive maintenance completed on time. By bus, by shop. Below 90% increases breakdown risk. Track PM completion weekly.
BusCMMS: PM compliance dashboard with alerts
3
Breakdown Analysis Report
Breakdown frequency by bus, by system, by cause. Mean time between failures (MTBF). Identify chronic problem vehicles. Spot recurring failure patterns.
BusCMMS: Breakdown trends and root cause analysis
4
Parts Usage & Inventory Report
Most-used parts by quantity and cost. Slow-moving dead stock (no usage in 12+ months). Reorder recommendations. Optimize inventory investment.
BusCMMS: Parts usage analytics and auto-reorder
5
Labor Efficiency Report
Labor hours per work order type, per mechanic, per bus. Compare planned vs actual hours. Identify training needs and productivity trends.
BusCMMS: Mechanic productivity tracking
6
Warranty Recovery Report
Warranty claims submitted, approved, denied, and pending. Recovery amount by component, by vendor. Track warranty expiration dates. Don't leave money on the table.
Cost per mile is the single most important fleet metric. Here's exactly how to calculate it and what to look for.
Cost Per Mile — Components & Calculation
ComponentFormulaExample (Monthly)
Fuel cost per mileFuel spend ÷ miles driven$4,500 ÷ 6,000 = $0.75
Parts cost per mileParts spend ÷ miles driven$1,200 ÷ 6,000 = $0.20
Labor cost per mileLabor spend ÷ miles driven$900 ÷ 6,000 = $0.15
Outside repairs per mileOutside repair spend ÷ miles driven$600 ÷ 6,000 = $0.10
Total cost per mileSum of all components$1.20 per mile
Run cost per mile report monthly by bus. Flag any bus 20% above fleet average. Investigate root cause within 48 hours.
What Fleets Using BusCMMS Report
"We ran our first cost per mile report in BusCMMS and found Bus 217 was costing $1.85 per mile — fleet average was $1.20. Investigation found a dragging brake caliper that had been reported by the driver six months ago but never repaired. That bus had wasted $3,900 in extra fuel. The report paid for itself in one finding." — Fleet Maintenance Manager, 85-bus school district, Michigan
PM Compliance Report: The Early Warning System
PM compliance predicts breakdowns. Low compliance today means breakdowns in 3-6 months. Track this metric weekly.
PM Compliance Calculation
(PMs completed on time ÷ Total PMs due) × 100. Track by bus, by shop, by month. Target: 95% or higher. Below 90%: immediate intervention required.
Breakdown reports tell you what failed. Breakdown analysis tells you why. Without root cause analysis, same failures repeat.
Mean
Mean Time Between Failures (MTBF)
Total operating hours ÷ Number of breakdowns. Higher MTBF = more reliable bus. Track by bus, by component. Identify buses with unusually low MTBF for investigation.
Mean
Mean Time To Repair (MTTR)
Total repair hours ÷ Number of breakdowns. Lower MTTR = faster repairs. Track by shop, by mechanic. Identify training needs.
Most fleets leave 15-25% of eligible warranty claims on the table. The warranty recovery report tracks what you've claimed, what's been paid, and what's expiring soon.
Warranty Recovery Rate
(Warranty payments received ÷ Eligible repairs cost) × 100. Industry average: 60-70%. Best-in-class: 85-95%. Low rates indicate missing documentation or missed deadlines.
Warranty Expiration Tracking
Track warranty expiration dates by component (engine, transmission, emissions, batteries). Report shows items expiring in next 30/60/90 days. Schedule inspections before expiration.
Claim Denial Analysis
Why were claims denied? Missing proof of maintenance (most common). Out-of-date inspection records. Improper documentation. Fix root causes to improve approval rate.
A good dashboard answers three questions: How are we doing overall? Where are the problems? What needs my attention right now? Here's how to build it.
Top
Top Section — Summary KPIs (Green/Yellow/Red)
Overall cost per mile (target vs actual). PM compliance percentage. Breakdown frequency (this month vs last month). Fuel economy (MPG). Warranty recovery rate. Green = on target. Yellow = warning. Red = immediate action needed.
Middle
Middle Section — Trend Charts
Cost per mile over last 12 months. PM compliance trend. Breakdowns by month. Fuel economy by month. Shows whether you're improving or declining.
Bottom
Bottom Section — Exception List
Buses with cost per mile >20% above average. Buses with PM overdue. Buses with frequent breakdowns. Drivers needing coaching. Parts below reorder point. Warranties expiring soon.
What are the most important fleet maintenance reports?
Cost per mile, PM compliance, breakdown analysis, parts usage, labor efficiency, and warranty recovery. These six reports provide complete visibility into fleet maintenance performance.
Typical school bus cost per mile: $0.60-0.80 for fuel only, $1.00-1.40 total operating cost (fuel + maintenance + labor + parts). Excellent fleets achieve under $0.50 fuel and under $1.00 total.
What is a good PM compliance target?
Target 95% or higher. Below 90% indicates serious breakdown risk. Below 85% guarantees frequent breakdowns. Track compliance weekly, not monthly.
Does BusCMMS include all six essential reports?
Yes. BusCMMS generates cost per mile, PM compliance, breakdown analysis, parts usage, labor efficiency, and warranty recovery reports automatically with one-click export.
How do I reduce maintenance reporting time?
Use fleet analytics software with pre-configured reports. Schedule automated report generation and distribution. Focus only on the six essential reports. Eliminate reports that don't drive decisions.
Six Reports. One Dashboard. Every Bus.
Essential fleet maintenance reports — cost per mile, PM compliance, breakdowns, parts, labor, warranty. All automated. All actionable. Free 14-day trial.