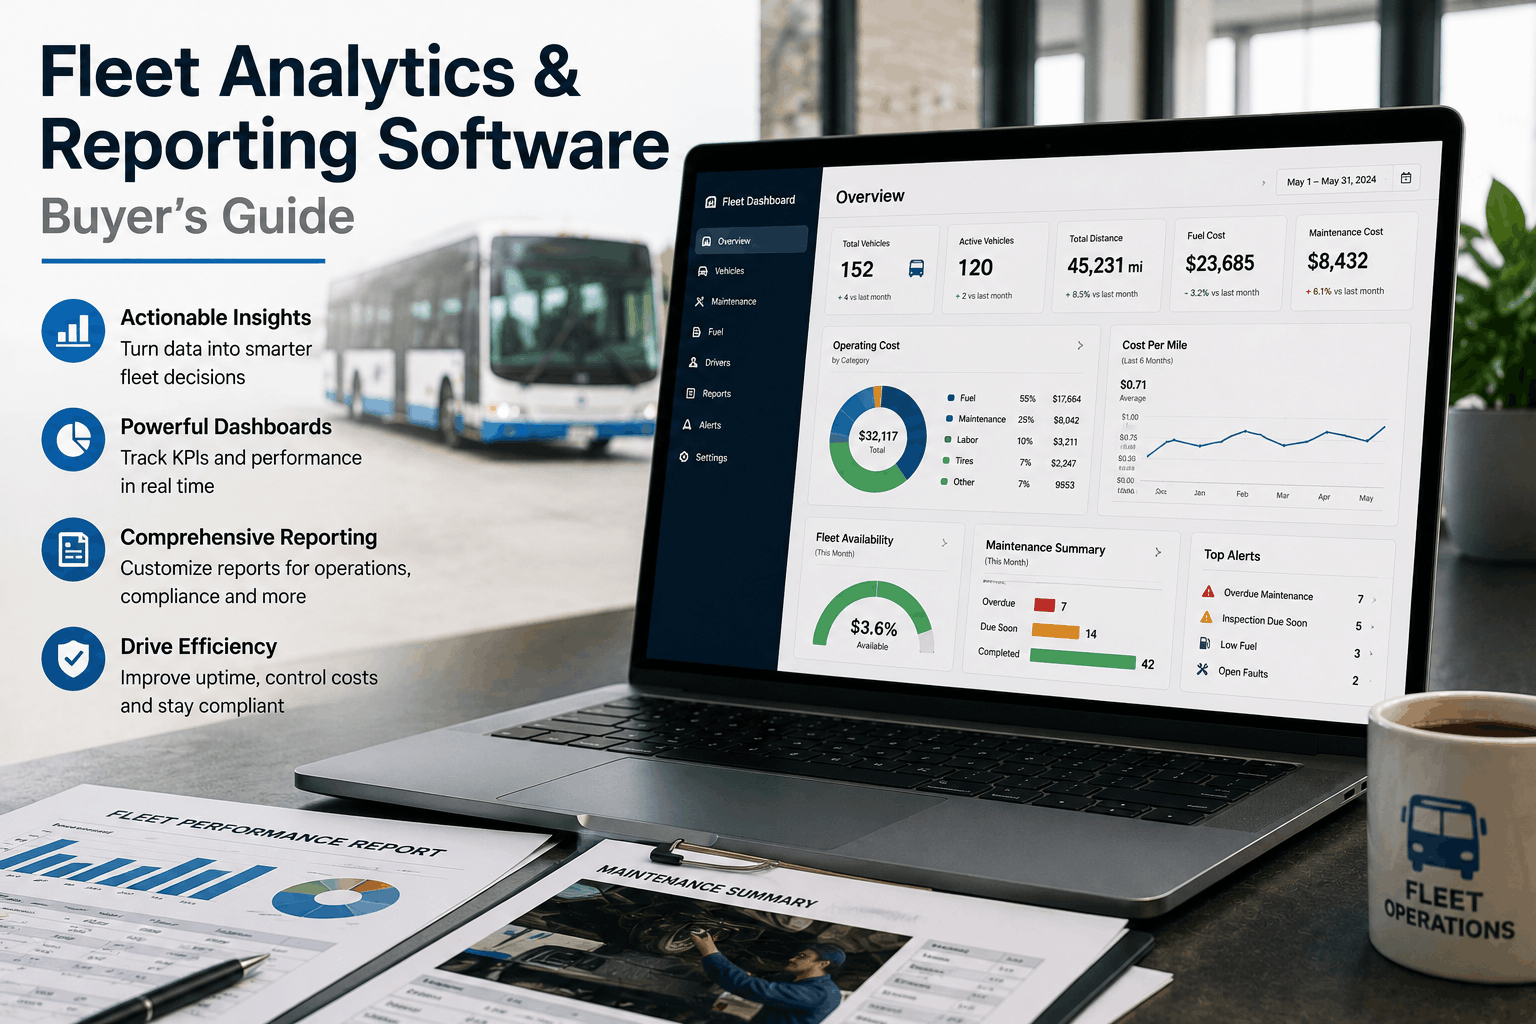
A 200-bus school district in Florida collected massive amounts of data. Mechanics logged repairs. Drivers submitted DVIRs. Fuel cards tracked every gallon. The maintenance system recorded every PM. But the data lived in separate silos — spreadsheets, paper logs, disconnected software. When the transportation director asked for the cost per mile by bus, it took two weeks to compile. When they needed to identify the most unreliable bus, no one could answer. When the school board requested a fuel efficiency report, they had to guess. The problem wasn't lack of data — it was lack of analytics. Fleet analytics software connects the silos, visualizes the data, and turns information into decisions. This guide covers what fleet analytics software does, which reports matter for bus fleets, and how to choose the right platform.
Fleet analytics software is a centralized platform that collects data from all your fleet systems — maintenance, fuel cards, telematics, DVIRs, driver files — and transforms it into actionable reports and dashboards. Unlike basic reporting tools that show raw data, analytics software provides visualizations (charts, graphs, heat maps), trend analysis (cost per mile over time), benchmarking (compare buses, drivers, routes), and predictive insights (upcoming maintenance needs). For bus fleets, analytics answers critical questions: Which buses have the highest cost per mile? Which drivers have the worst fuel efficiency? Which maintenance tasks are overdue? What's the total cost of ownership for each bus? Without analytics, fleet managers operate on intuition. With analytics, they operate on data.
BusCMMS: Pre-built integrations with fuel cards, telematics, and ELDs
KPI
KPIs & Dashboards — What to Measure
Cost per mile, cost per bus, fuel economy (MPG), PM compliance percentage, breakdown frequency, mean time between failures (MTBF), mean time to repair (MTTR), parts inventory turns, labor hours per PM, DVIR defect rate, idle time percentage.
BusCMMS: Pre-configured KPI dashboards for bus fleets
Not all reports are created equal. These are the high-impact reports that drive decision-making and cost savings.
Cost Per Mile Report
Fuel cost + maintenance cost + labor cost divided by miles driven. Compare by bus, by route, by month. Identify high-cost outliers. Track trends over time.
PM Compliance Report
Percentage of scheduled PMs completed on time. By bus, by mechanic, by shop. Below 90% compliance increases breakdown risk. Track trends weekly.
Breakdown Analysis Report
Breakdown frequency by bus, by system (engine, brakes, electrical), by cause. Identify chronic problems. Calculate mean time between failures (MTBF).
Fuel Efficiency Report
MPG by bus, by driver, by route, by month. Flag underperforming vehicles for mechanical inspection. Identify drivers needing coaching on eco-driving.
Parts Usage Report
Most-used parts by quantity and cost. Identify high-consumption items for bulk purchasing. Flag slow-moving dead stock (no usage in 12+ months).
Labor Efficiency Report
Labor hours per work order type, per mechanic, per bus. Identify training needs. Track productivity trends. Compare planned vs actual hours.
Both dashboards and reports have their place. Understanding the difference helps you choose the right tool for each purpose.
Live
Real-Time Dashboards
Live view of current fleet status. Always up to date. Best for: monitoring PM compliance this week, tracking open work orders, checking fuel economy today, identifying buses due for inspection soon, spotting breakdowns as they happen. Updates continuously.
Periodic
Periodic Reports (Daily, Weekly, Monthly)
Static snapshots for analysis, sharing, and record keeping. Best for: monthly cost per mile trend analysis, quarterly board presentations, annual budget planning, driver coaching scorecards (share with drivers), audit documentation. Run on schedule or on demand.
What Fleets Using BusCMMS Report
"Before analytics, we generated monthly reports manually — exporting from five different systems, combining in Excel, formatting for leadership. It took three days every month. Now with BusCMMS dashboards, I have real-time visibility into cost per mile, PM compliance, and fuel economy. The board gets automated monthly reports delivered to their inbox. I saved 30 hours per month. That's two full months of time per year back." — Fleet Analytics Manager, 150-bus transit system, Texas
Cost Per Mile: The Most Important Fleet KPI
Cost per mile is the single metric that captures total fleet efficiency. It combines fuel, maintenance, labor, and parts into one number. Track it by bus, by route, and over time.
Cost Per Mile Components — What to Track
ComponentTypical RangeWhat It Includes
Fuel cost per mile$0.50–0.80Diesel, DEF, electricity for electric buses
Maintenance cost per mile$0.15–0.40Parts, shop supplies, outside repairs
Labor cost per mile$0.10–0.25Mechanic wages, benefits, overtime
Total cost per mile$0.75–1.45Sum of all operating costs divided by miles
Track cost per mile monthly. Flag any bus 20% above fleet average. Investigate root causes immediately.
Predictive Analytics: Moving from Reactive to Proactive
Basic analytics tells you what happened. Predictive analytics tells you what will happen. For bus fleets, predictive analytics identifies: which buses will need brake replacement in the next 30 days based on wear rate, which parts will run out based on usage trends, which drivers are at risk of HOS violations based on patterns, which maintenance tasks are being missed, and when the next breakdown is likely based on historical failure patterns.
Reactive (No Analytics)
Fix after breakdown. Emergency repair costs. Unscheduled downtime. Rush shipping for parts. Driver hours lost. Late routes. Angry passengers. Higher total cost.
Predictive (With Analytics)
Fix before breakdown. Scheduled repair during off-hours. Standard parts ordering. No downtime. Normal shipping. Lower total cost. Higher reliability. Better safety.
Benchmarking: Compare Your Fleet to Industry Standards
Knowing your numbers is good. Knowing how you compare to similar fleets is better. Benchmarking answers: Is our cost per mile normal for our fleet size and region? Is our PM compliance rate above or below average? Is our fuel economy competitive? Without benchmarking, you don't know if you're leading or lagging. Use these industry benchmarks as a starting point.
Bus Fleet Benchmarks — School Buses (Mixed Routes)
MetricExcellentGoodNeeds Improvement
Cost per mile (fuel only)$0.50–0.60$0.60–0.70$0.70+
Fuel economy (MPG)6.5–7.55.5–6.5Below 5.5
PM compliance (%)95–100%85–94%Below 85%
Breakdowns per 100k milesUnder 22–4Over 4
Idle time (%)Under 10%10–15%Over 15%
Source: Industry data from 500+ bus fleets. Your numbers may vary by region, terrain, and duty cycle. Use as directional guidance, not absolute standards.
How to Choose Fleet Analytics Software
Not all analytics platforms are created equal. Use these criteria to evaluate options.
1
Data Integration Capabilities
Does it connect to your existing systems? Fuel cards? Telematics? Maintenance software? ELDs? Manual data entry should be minimal. APIs and pre-built connectors matter.
2
Pre-Configured Fleet Dashboards
Does it come with bus-specific KPIs out of the box? Cost per mile, PM compliance, fuel economy, parts usage, labor efficiency. Or do you have to build everything from scratch?
3
Custom Report Builder
Can you create custom reports for your specific needs? Export to Excel, PDF, CSV for sharing with leadership, auditors, and board members?
4
Mobile Access
Can you view dashboards on your phone? When you're in the shop or on the road, you need access to real-time data. Mobile-responsive design matters.
5
Alerting & Notifications
Does it alert you when metrics exceed thresholds? Text, email, in-app alerts for high cost per mile, low PM compliance, upcoming expirations?
Fleet analytics software centralizes data from maintenance, fuel cards, telematics, and DVIRs, then provides dashboards, reports, and insights to optimize fleet operations and reduce costs.
What are the most important KPIs for bus fleets?
Cost per mile, PM compliance percentage, fuel economy (MPG), breakdown frequency, idle time percentage, parts inventory turns, and mean time between failures (MTBF).
How much can fleet analytics reduce operating costs?
Fleets using analytics software typically reduce total operating costs by 8-15% through improved fuel economy, reduced breakdowns, optimized parts inventory, and better labor efficiency.
Does BusCMMS include pre-built fleet reports?
Yes. BusCMMS includes cost per mile, PM compliance, fuel economy, parts usage, labor efficiency, breakdown analysis, and driver performance reports — all pre-configured for bus fleets.
Can I export fleet reports for audits or board presentations?
Yes. BusCMMS exports any report as PDF, Excel, or CSV. Schedule automated email delivery daily, weekly, or monthly to stakeholders.
How does predictive analytics help bus fleets?
Predictive analytics identifies which buses need maintenance before failure, which parts will run out before next order, and which drivers need coaching — shifting from reactive to proactive management.
Every KPI. Every Bus. One Dashboard.
Real-time fleet analytics. Automated reporting. Cost per mile tracking. PM compliance. Fuel economy. Parts usage. All in one system. Free 14-day trial.