A 156-bus school district in Texas spent $2.1 million on diesel in 2025. When the finance director asked the maintenance manager to break down fuel costs by bus, he couldn't. The data was spread across fuel card statements, mechanic logs, and driver notes. Some buses were getting 3.2 MPG. Others were getting 5.8 MPG on identical routes. The district was losing $180,000 annually on inefficient buses they couldn't identify. Six months after implementing fuel management software, they found that Bus 407 had a dragging brake caliper — costing $4,200 in extra fuel over 18 months. Bus 203 had bad injectors — $7,800 in waste. Bus 512 was idling 4 hours daily — $3,600 annually. The software paid for itself in 60 days. This guide covers exactly how fleet fuel management software works, what features matter, and how to choose the right platform for 2026.
Fleet Fuel Management Software: Complete Guide & Comparison
Track every gallon. Identify inefficient buses. Cut fuel spend 8-15%. Integrate fuel cards and telematics. Measure real ROI.
Fleet Fuel Software — ROI Impact
Fuel is the largest variable operating cost for bus fleets. A 10% reduction pays for fuel management software many times over annually.
What Is Fleet Fuel Management Software?
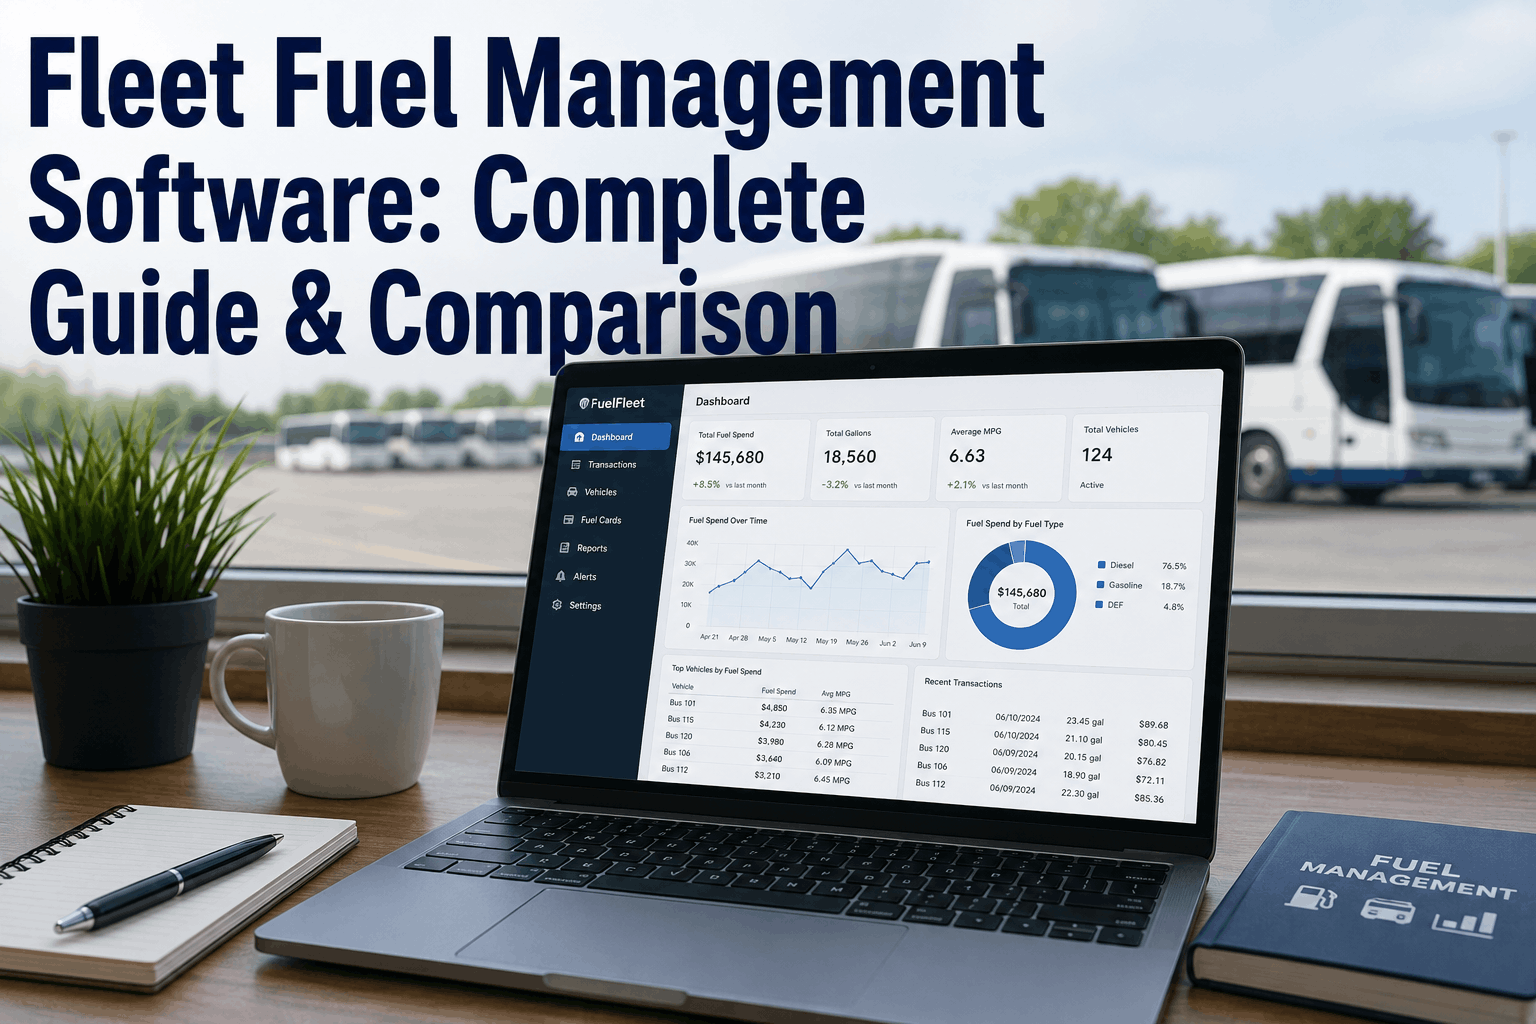
Fleet fuel management software centralizes all fuel-related data into a single dashboard. It connects to your fuel card provider(s) to import every transaction automatically — date, time, location, gallons, cost per gallon, odometer reading (if captured), and vehicle identification. The software calculates MPG per bus, per driver, per route, and over time. It identifies anomalies: a bus that suddenly drops from 6 MPG to 4 MPG has a mechanical problem. A driver who consistently gets lower MPG than peers on similar routes has a behavior problem. A route that requires more fuel than expected has a planning problem. The software also tracks idle time (if integrated with telematics) and reports on fuel tax by jurisdiction. Without this software, fleets rely on spreadsheets and manual data entry — errors, omissions, and waste.
"We had 120 buses and no idea which ones were efficient. Drivers wrote odometer readings on paper fuel logs. Mechanics entered them into Excel. The math was always off. Fuel management software integrated with our Wright Express cards overnight. Within a week, we identified 12 buses getting under 4 MPG — all had mechanical issues we had missed. The first repair paid for the software."
Core Fuel Management Features
Fuel Card Integration: The Data Source
Fuel cards are the primary data source for fleet fuel management. Major providers include WEX (Wright Express), Fuelman, Voyager, Comdata, and regional fuel networks. Fuel management software must integrate with your existing fuel cards — or offer its own fuel card program. The integration should pull transaction data daily or in real time: driver ID (or vehicle ID if assigned), odometer reading (entered at pump), gallons purchased, total cost, price per gallon, location, date, and time. The software then assigns each transaction to the correct bus record. The most common integration failure is missing odometer readings — drivers skip entering them at the pump. Good fuel software allows mechanics to enter missing odometer readings later, or integrates with telematics to auto-populate odometer at time of fueling.
Fuel Card Data Gaps (Without Software)
Missing odometer readings — can't calculate MPG
Wrong vehicle assignment — driver enters wrong bus number
Manual data entry errors — typos in gallons or miles
No integration — data sits in separate portal
No exception detection — fraud or waste goes unnoticed
Manual fuel tracking costs 3-5 hours of staff time weekly per 50 buses.
Software-Integrated Fuel Tracking
Automatic import — zero manual data entry
Vehicle assignment validation — flags mismatches
Telematics integration — auto-odometer from GPS
Real-time MPG calculation per fill-up
Automated exceptions — unusual gallons, time, or location
90% reduction in fuel data errors with automated integration.
Fuel Economy Metrics: What to Track
Raw fuel spend is less useful than fuel economy metrics. Track MPG per bus, per driver (if drivers are assigned consistently), per route, and by season. Diesel bus expected MPG: 3.5–5.0 MPG for transit (frequent stops), 5.0–7.0 MPG for school buses (mixed routes), 6.0–8.5 MPG for charter/coach (highway). Electric bus equivalent: 0.5–0.8 MPGe (but measure in kWh per mile). Track MPG as a rolling average over 5-10 fill-ups to smooth outliers. Compare MPG month over month and year over year. A 0.5 MPG drop across a 100-bus fleet at $4.00/gallon with 10,000 miles per bus annually = $57,000 in extra fuel cost. That drop is your signal to investigate — dragging brakes, underinflated tires, bad injectors, or driver behavior.
Fuel Economy by Bus Type — Expected MPG (Diesel)
Below these ranges: mechanical issue, underinflation, or driver behavior. Track MPG per bus weekly.
A bus that drops 0.5 MPG below its baseline is burning an extra $2,000–$4,000 in fuel annually. That's enough to pay for a full brake service or a set of tires. Investigate every MPG drop.
Idle Time Monitoring & Reduction
Idling is the largest controllable fuel waste in bus fleets. A diesel bus idling consumes 0.5–1.0 gallon per hour. For a fleet of 100 buses, each idling 30 minutes daily beyond necessary, that's 50 gallons per day, 250 gallons per week, 13,000 gallons per year — $52,000 at $4.00/gallon. Idle time tracking requires telematics integration (GPS that reports engine runtime) or CAN bus data from the engine ECU. Fuel management software with idle tracking shows which buses idle excessively, which drivers idle longer, and which routes have built-in idle time. Set idle reduction policies: warm-up time limited to 5 minutes (diesel) or 2 minutes (electric). Idle alerts notify drivers when they exceed limits. Post-idle reports per driver create accountability.
Idle Fuel Consumption — Annual Cost (100-bus fleet, $4/gal)
Most fleets can reduce unnecessary idle time by 40-60% with driver training and automated idle alerts — saving $20,000–$60,000 annually.
"We had no idea how much our buses idled during student loading. Drivers kept engines running for heat in winter and AC in summer. We installed idle monitoring through our telematics and set a 5-minute idle limit before automatic alerts. In six months, idle time dropped 65%. Annual fuel savings: $47,000. The software paid for itself in the first two months of idle reduction alone."
Fuel Theft & Fraud Detection
Fuel fraud takes many forms: drivers fueling personal vehicles, drivers selling fuel cards, unauthorized fuel grades, or filling at non-preferred stations with higher prices. Fuel management software detects anomalies. Unusually large fuel purchases (bus holds 80 gallons but transaction shows 120 gallons). Off-hour fueling (3 AM fill-ups that don't match normal routes). Fuel grade mismatch (bus takes diesel but transaction shows premium gasoline). Location anomalies (fueling at stations far from bus route). Frequent fill-ups (fueling every day when the bus runs 80 miles — impossible). The software flags these transactions for review. Many fleets find 3-7% of monthly fuel spend is fraudulent or wasteful. Stopping fraud alone often pays for the software.
Fuel Exception Alerts — What to Monitor
Fuel fraud is not rare. A 100-bus fleet losing 5% to fraud or waste is losing $60,000–$100,000 annually. Most fleets don't detect it without automated exception reporting.
Fuel Tax Reporting & IFTA Compliance
Fleets that operate across state lines must file IFTA (International Fuel Tax Agreement) quarterly reports. Fuel management software automates IFTA reporting by tracking fuel purchases by jurisdiction and miles driven per jurisdiction (requires telematics or ELD integration). The software calculates tax due (or refund) for each jurisdiction, generates the required report forms, and sometimes submits them directly. Without automation, IFTA reporting takes hours of manual calculation and carries error risk. Errors trigger audits and penalties. Good fuel software also tracks fuel used in off-highway applications (gen sets, heaters) — those gallons are not subject to road tax. Manual tracking often misses these, causing fleets to overpay taxes by 2-5% annually.
Fuel Tax Compliance — Software Benefits
Fleet Expert Review
Fuel is the largest variable operating cost for bus fleets — typically 25-35% of total operating budget. Yet most fleets manage fuel with disconnected spreadsheets and manual data entry. The result: undetected MPG drops (mechanical waste), excessive idling (behavioral waste), fueling errors and fraud (transactional waste), and compliance risk (tax penalties). Fuel management software solves all four with automated data import, real-time MPG tracking, idle alerts, exception detection, and automated tax reporting. The ROI is typically 3-8 months. A 10% fuel reduction on a $1.5 million annual fuel spend saves $150,000 per year. The software that costs $15,000 annually pays for itself ten times over. The fleets without fuel software are leaving money at every pump.
The Bottom Line
Fuel management software is not optional for professional bus fleets. Without it, you cannot track MPG per bus, identify inefficient vehicles, catch fuel fraud, reduce idle waste, or automate tax reporting. The savings are substantial: 8-15% reduction in fuel spend through mechanical fixes, behavior change, and fraud detection. A fleet spending $1.5 million annually on fuel saves $120,000–$225,000 per year. The payback period: 3-8 months. BusCMMS includes complete fuel management: fuel card integration, MPG tracking per bus, idle monitoring (with telematics), exception alerts for unusual transactions, and automated IFTA reporting. One dashboard gives you complete visibility into every gallon of fuel your fleet consumes.
Every Gallon. Every Bus. One Dashboard.
Fuel card integration, MPG tracking, idle monitoring, fraud detection, IFTA reporting. Reduce fuel spend 8-15%. Free 14-day trial.
Frequently Asked Questions
What fuel economy (MPG) should I expect from diesel school buses?
How much fuel does a school bus waste idling?
Can fuel management software detect fuel theft?
Does BusCMMS integrate with my existing fuel cards?
What is a good MPG for an electric school bus?
How quickly does fuel management software pay for itself?
Diesel + Electric + CNG. Fuel + Energy. One System.
Fuel management for diesel, electricity consumption for EVs, and CNG volume tracking. All fuel types. All data. One dashboard. Free 14-day trial.


