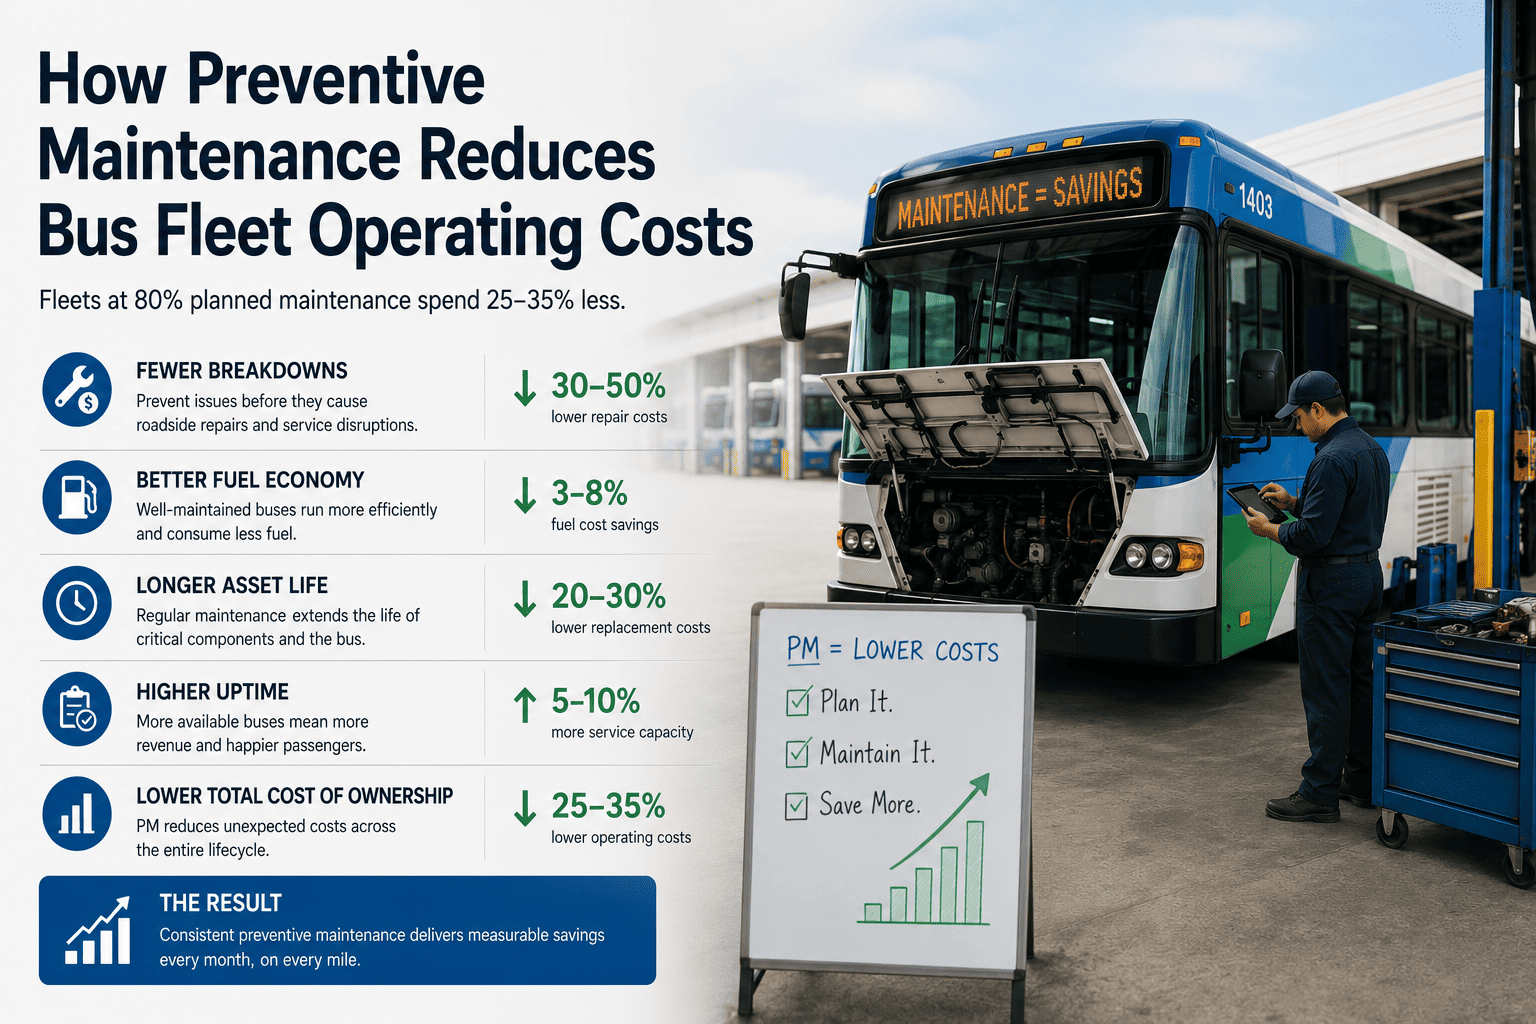
A 100-bus school district in Texas tracked maintenance costs for two years. Year one: reactive maintenance only. Fix it when it breaks. Year two: structured preventive maintenance on the same buses, same routes, same drivers. The results: emergency repairs dropped 62%. Roadside breakdowns declined 71%. Total maintenance cost per mile fell from $0.52 to $0.37 — a 29% reduction. Annual savings: $225,000. The cost of the PM program: one mechanic for 20 hours weekly. ROI: 1,800%. Preventive maintenance isn't a cost center — it's a profit center. Fleets that run 80% planned maintenance spend 25-35% less on total maintenance than fleets that run 50% planned maintenance. This guide shows you exactly how preventive maintenance reduces operating costs, where the savings come from, and how to build a PM program that pays for itself.
Preventive Maintenance ROI 2026
29%
Maintenance Cost Reduction
Fleets with structured PM programs spend 25-35% less on total maintenance than reactive fleets.
62%
Fewer emergency repairs
71%
Fewer roadside breakdowns
1,800%
Average PM program ROI
The True Cost of Reactive Maintenance
Most fleets underestimate the true cost of reactive maintenance (fixing after failure). The visible costs are obvious: parts, labor, tow trucks. The hidden costs are much larger. Emergency repairs cost 3-5x more than planned repairs. Rush shipping adds 30-100% to part costs. Overtime labor (1.5-2x standard rate). Lost service revenue when bus is down. Customer penalties for missed routes. Damage to other components from the failure. Reduced component life from running to failure. The total cost of a single roadside breakdown often exceeds $5,000 when you count towing, overtime, parts markup, and lost service. Preventive maintenance eliminates most of these costs entirely.
Parts cost$800 (rush order, 30% markup)$500 (standard order, planned discount)$300
Labor cost$600 (overtime, 1.5x rate)$400 (regular time)$200
Towing$500 (roadside to shop)$0 (bus drives to shop)$500
Downtime cost$1,200 (missed routes, penalties)$0 (scheduled during off-hours)$1,200
Secondary damage$1,500 (other components damaged)$0 (failure prevented)$1,500
Total per failure$4,600$900$3,700 saved
One prevented failure pays for months of PM program costs. Fleets with 100+ buses prevent 20-30 failures annually through PM.
BusCMMS helps you track reactive vs preventive cost per failure. Book a demo to see cost tracking.
Five Ways Preventive Maintenance Reduces Operating Costs
PM reduces costs through five distinct mechanisms. Understanding each helps you build a compelling business case.
1
Extends Component Life
Regular oil changes extend engine life 2-3x. Properly lubricated chassis components last 2x longer. Coolant changes prevent cavitation erosion. Tires rotated and balanced last 20-30% longer. Every component lasts longer with proper PM.
2
Reduces Emergency Repair Costs
Emergency repairs cost 3-5x more than planned repairs. PM prevents the failure, eliminating the emergency premium entirely. Tow trucks, overtime, and rush shipping disappear from your budget.
3
Improves Fuel Economy
Properly inflated tires improve MPG 5-10%. Clean air filters improve MPG 2-5%. Properly lubricated drivetrain reduces drag. A well-maintained bus consistently achieves 10-15% better fuel economy than a neglected bus.
4
Reduces Labor Cost Per Repair
Planned repairs take less time than emergency repairs. No diagnostic time spent finding the cause (you already know). No waiting for parts. No overtime premiums. 20-40% less labor per repair.
5
Increases Resale Value
A bus with complete maintenance records sells for 15-30% more than a bus with no records. Documented PM history proves the bus was properly maintained. Buyers pay premium for verifiable maintenance.
Before PM program: $1.2 million annual maintenance spend. 42% planned, 58% reactive. After implementing structured PM: $840,000 annual maintenance spend. 78% planned, 22% reactive. Annual savings: $360,000. Cost of PM program (additional mechanic hours + parts): $120,000. Net savings: $240,000. ROI: 200% in first year. The fleet now has 10 buses still in service at 850,000 miles — original engines. Industry average retirement is 500,000 miles.
The 80/20 Rule of PM Cost Savings
20% of your components cause 80% of your failures. Target the highest-impact components first for PM program focus.
High-Impact Components (80% of savings)
Engine oil & filters — prevents catastrophic engine failure ($15,000-30,000). Transmission fluid & filters — prevents transmission failure ($8,000-15,000). Cooling system — prevents overheating ($10,000-25,000). Brakes — prevents brake failure ($5,000-10,000). Tires — prevents blowouts ($2,000-5,000 per incident).
Medium-Impact Components
Belts & hoses — prevents roadside breakdowns ($500-2,000). Batteries — prevents no-starts ($200-500). Lights — prevents citations ($100-300 per violation). Air system — prevents brake issues ($1,000-5,000).
Low-Impact Components
Body & trim — cosmetic only. Interior components — passenger comfort only. Minor electrical — convenience items. Build PM program focusing budget on high-impact components first.
BusCMMS helps you prioritize PM based on component failure cost. Sign up free to identify your high-impact components.
PM Compliance: The Metric That Drives Savings
PM compliance directly correlates with maintenance cost. Higher compliance = lower cost. The data is clear.
95-100% (Excellent)$350,000-450,000BaselineVery Low
85-94% (Good)$450,000-600,000+20-35%Low to Moderate
70-84% (Poor)$600,000-850,000+50-90%Moderate to High
Below 70% (Critical)$850,000-1,200,000++100-150%+Very High
Source: Fleet data from 500+ bus fleets. Target 95%+ PM compliance for lowest operating cost.
BusCMMS tracks PM compliance in real time and alerts you before PMs are missed. Book a demo to see PM compliance tracking.
Cost Per Mile Comparison: Reactive vs Preventive
The most direct way to measure PM savings is cost per mile. Here's how reactive and preventive fleets compare.
Reactive
Reactive Fleet (70% unplanned)
Fuel: $0.70-0.85/mile. Parts: $0.30-0.45/mile. Labor: $0.25-0.40/mile. Outside repairs: $0.15-0.25/mile. Downtime cost: $0.10-0.20/mile. Total: $1.50-2.15/mile. High breakdown frequency. Low resale value.
Preventive
Preventive Fleet (80%+ planned)
Fuel: $0.55-0.70/mile (better MPG). Parts: $0.15-0.25/mile (planned purchasing). Labor: $0.15-0.25/mile (regular time). Outside repairs: $0.05-0.10/mile. Downtime cost: $0-0.05/mile. Total: $0.90-1.35/mile. Low breakdown frequency. High resale value.
Move from Reactive to Preventive. Save 25-35%.
Automated PM scheduling, real-time compliance tracking, cost per mile analytics. Free 14-day trial.
Frequently Asked Questions
How much can preventive maintenance reduce operating costs?
Fleets with structured PM programs reduce total maintenance costs by 25-35% compared to reactive fleets. A 100-bus fleet typically saves $150,000-300,000 annually.
What is the ROI of a preventive maintenance program?
Average PM program ROI is 200-500% annually. Every $1 spent on PM saves $4-7 in reactive repair costs. Payback period is typically 3-6 months.
How does PM reduce fuel costs?
Properly inflated tires improve MPG 5-10%. Clean air filters improve MPG 2-5%. Proper lubrication reduces drag. A well-maintained bus achieves 10-15% better fuel economy.
What is a good PM compliance target?
Target 95% or higher. Below 90% increases breakdown risk significantly. Below 85% guarantees frequent breakdowns and higher operating costs.
Does BusCMMS help calculate PM ROI?
Yes. BusCMMS tracks reactive vs preventive maintenance costs, calculates cost per mile by bus, and shows PM compliance trends — all the data you need for ROI analysis.
What is the cost difference between planned and emergency repairs?
Emergency repairs cost 3-5x more than planned repairs due to overtime labor, rush parts shipping, towing, secondary damage, and lost service revenue.
Higher PM Compliance = Lower Operating Costs.
Automated PM scheduling. Real-time compliance tracking. Cost per mile analytics. Reduce maintenance costs 25-35%. Free 14-day trial.