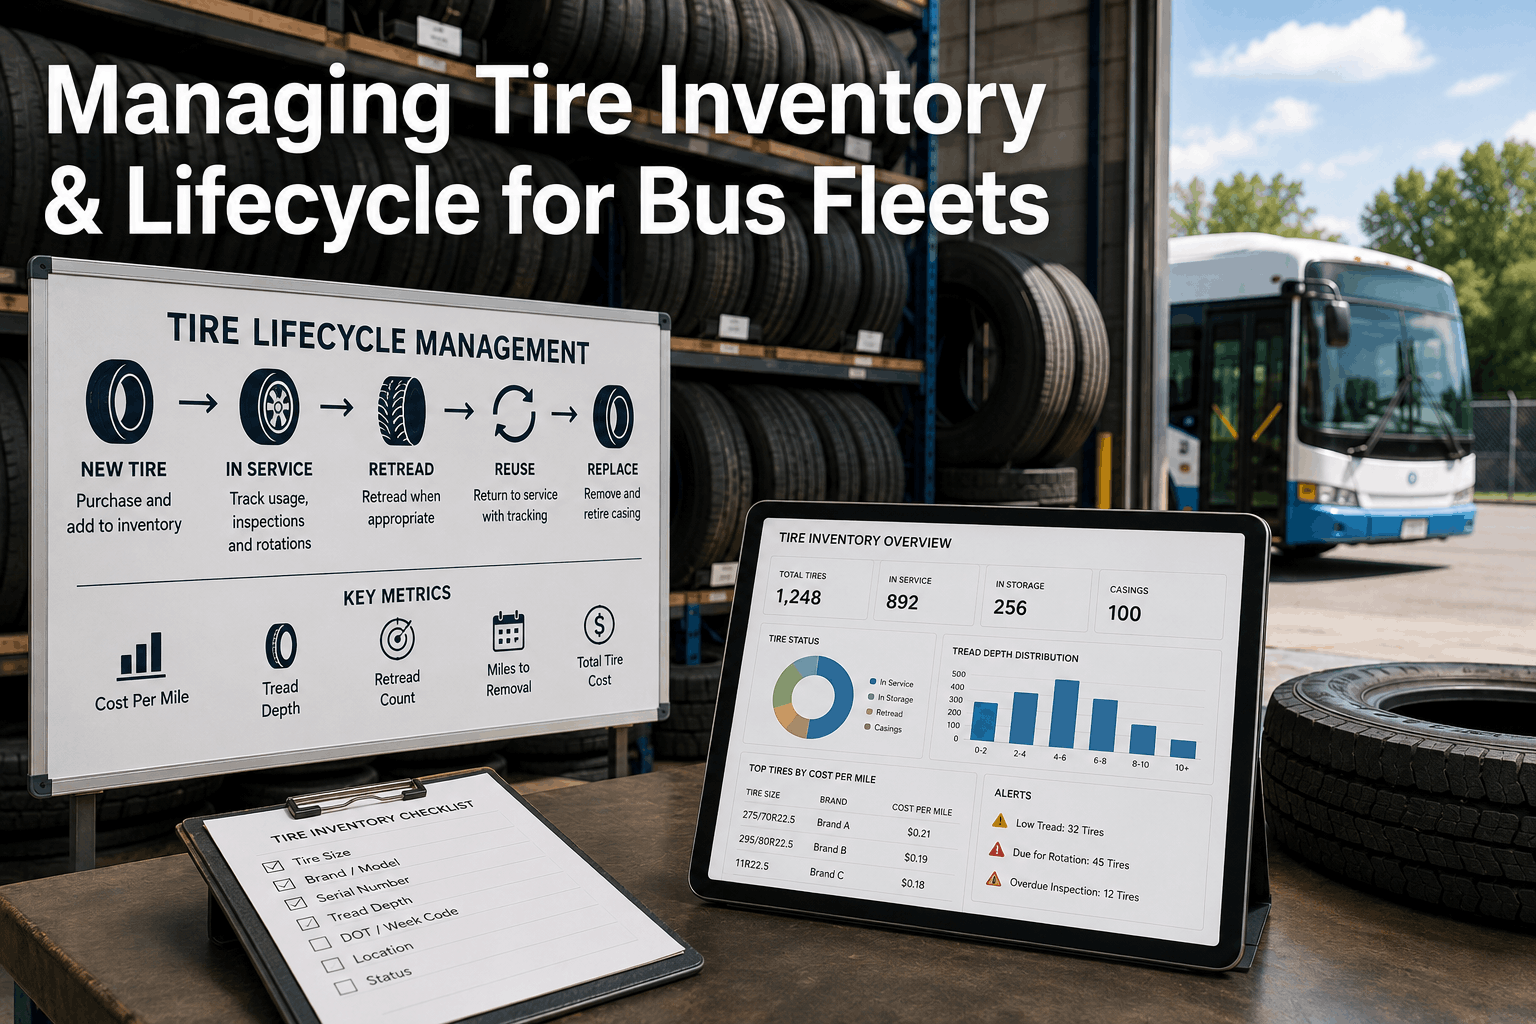
Tires are often the highest material cost in fleet operations—exceeding parts, fuel, or even labor in some regions. A 100-bus fleet operating in North America spends $180,000–$280,000 annually on tires alone. This includes initial purchase, mounting, balancing, repairs, and eventual replacement. The complexity multiplies when fleets adopt tire-retreading programs or casing rotation strategies. A typical transit bus tire lasts 4–5 years or 400,000–500,000 miles. A retread adds 150,000–200,000 miles (extending life 2–3 additional years) at 40–45% of new tire cost. Managing tire inventory—new tires, casings awaiting retreading, retreaded inventory, puncture repairs—across multiple vehicle types (articulated vs. rigid body), drive positions (drive axle tires wear differently than steer/trailer), and seasonal patterns (winter tires vs. summer) requires sophisticated tracking and procurement strategy. Fleet operators using data-driven tire inventory management cut tire cost 15–28% while improving safety and uptime. This guide explains tire lifecycle management, casing inventory optimization, retread economics, and how CMMS-integrated tire tracking transforms tire cost from an unmanaged expense into a controlled, optimizable profit center.
Managing Tire Inventory & Lifecycle for Bus Fleets
Tires are a top fleet expense: $180K–$280K annually for a 100-bus fleet. Strategic casing management, retread optimization, and data-driven inventory reduce tire cost 15–28% while improving safety. Learn to balance new, retread, and repair inventory across vehicle types and seasonal demand.
Tire Cost Benchmarks
Data from 280 North American transit operators
Understanding Tire Lifecycle: New, Retread, and Repair Strategy
Modern fleet tire economics revolve around one principle: extend tire life through retreading. A new bus tire costs $400–$650 and lasts approximately 400,000–500,000 miles (4–5 years for a typical transit bus). Once worn, the tire is removed and designated as a "casing"—the rubber shell without tread. A quality casing can be sent to a tire remanufacturer (retread facility) where the worn tread is stripped, new tread is bonded to the casing, and the tire is tested and returned to service. A retreat costs $160–$220 and adds 150,000–200,000 miles of additional life (2–3 additional years). From one original tire, a fleet effectively gets two usable tires: the initial service (400K miles for $400–$650 cost = $0.0010–$0.0016/mile) plus the retread service (150K–200K miles for $160–$220 cost = $0.0008–$0.0015/mile). This extends useful life by 50–100% and reduces cost per mile by 40–50%. Not all casings are suitable for retreading. Casings with sidewall damage, excessive tread wear, or structural defects are scrapped. Industry average: 70–85% of casings are suitable for retreading. For a 100-bus fleet, this means careful inventory management: track which tires are candidates for retreading, manage the logistics of casing shipment to remanufacturer, manage retreaded tire inventory return, and minimize the gap between removal and retreading (casing "aged" tires cost carrying cost). Strategic fleets reduce tire cost 15–28% by optimizing this lifecycle.
Tire Lifecycle Economics — One Tire
100-Bus Fleet Tire Spend Strategy
Optimize your tire lifecycle strategy — request consultation
Casing Management: Converting Worn Tires Into Assets
The difference between high-performing and struggling fleets is casing management discipline. When a tire is worn, the fleet has a choice: scrap it (total loss of value) or send it for retreading (recover 30–40% of the casing value). A worn tire casing worth $100–$150 in retreading potential that's scrapped represents pure loss. In a 100-bus fleet removing 150 worn tires annually, choosing to scrap instead of retread loses $15,000–$22,500 in annual value recovery. Beyond the financial loss, poor casing management creates logistics chaos: casings stack in the yard, taking up space; some casings age (rubber degrades); ownership of casings becomes unclear (whose responsibility is it to manage?); and eventually casings are disposed as waste. Strategic fleets implement casing management discipline: (1) at tire removal, immediately inspect the casing for retreading suitability; (2) segregate suitable casings from scrap; (3) maintain a log of casings awaiting retreading (part of CMMS); (4) batch casings for shipment to remanufacturer (typically 50–100 units per shipment to optimize freight); (5) track retreaded tires in return inventory; (6) minimize casing aging time (ideal: 4–8 weeks from removal to retreading start). This discipline reduces tire cost 8–12% through value recovery alone, before considering the extended tire life from retreading.
We weren't tracking casings at all. Worn tires sat in a lot for months before we occasionally shipped some for retreading. We calculated that 15–20% of casings were being scrapped that should have been retreaded. Implementing casing tracking in our CMMS and managing batched shipments to our remanufacturer saved us $18,000 annually just from better casing recovery. The retreaded tires are another $12,000 savings. Combined, we cut tire cost 16% in the first year by treating casings like assets, not waste.
Casing Management Steps
Casing Value Recovery (100-Bus Fleet, Annual)
Retread Inventory Optimization: Balancing Cost and Availability
Retreaded tires offer 40–45% cost savings vs. new tires, but they come with logistics complexity: supply chain delay (5–10 days for remanufactured tires vs. 2–3 days for new), variable availability (remanufacturer may not have your specific size in stock), and lower mileage expectancy (150K–200K vs. 400K–500K for new). This creates an inventory puzzle: you need enough retreaded tires in stock to avoid the temptation to buy new (expensive) when you could wait for retreads (cheap), but you can't overstock because retreaded tires degrade faster and carrying cost is significant. For a 100-bus fleet using 100–120 retreaded tires annually, the optimization strategy is: (1) forecast retread demand by vehicle type and season; (2) maintain a rolling safety stock of 15–20 retreaded tires appropriate to your fleet mix (articulated vs. rigid, drive vs. steer position); (3) work with your remanufacturer on 3–5 day delivery SLAs for common sizes; (4) implement alert thresholds in CMMS (when retread stock drops to safety level, automatically order next batch). The goal is to keep 5–8 weeks of retreaded inventory in rotation while minimizing the total number of tires held at any time. Sophisticated fleets reduce retread stocking cost 12–18% through demand forecasting and just-in-time ordering while maintaining 98–99% availability.
Retread Inventory Optimization — Annual Cycle (100-Bus Fleet)
98–99% availability; minimal overstock; 12–18% carrying cost reduction
Drive Position & Tire Rotation: Maximizing Casing Reusability
Tire wear patterns vary dramatically by axle position. Drive axle tires (powered wheels) wear more aggressively due to traction demands and acceleration forces. Steer axle tires (front wheels) wear less but experience different stress (lateral forces from turning). Trailer axles wear least. A strategic rotation program moves tires between positions to equalize wear and extend casing life. For example: a drive axle tire worn to 30% tread depth is moved to steer position for additional life. When it reaches 20% tread depth, it's moved to trailer position. By rotating through three positions, a casing suitable for retreading extends from one life cycle (400K miles) to 1.2–1.5 life cycles (480K–600K miles) before becoming a retreading candidate. This 20–50% life extension significantly improves casing recovery value and reduces net tire cost per mile. A systematic tire rotation program requires tracking: which tires are in which positions, how much tread remains, when rotation is due. This tracking belongs in CMMS, integrated with preventive maintenance schedules. A tire rotation PM task (every 50,000 miles or 6 months) ensures consistency and captures the data needed to optimize casing management. Fleets implementing systematic tire rotation programs reduce tire cost 5–8% through extended casing life alone.
Without Tire Rotation Program
Drive axle tires wear to 40–50% tread depth; moved directly to scrap or retreading
Steer/trailer tires wear to 20–30%; short life, limited reusability
Average tire life: 400K miles; casing recovery rate 65–70%
Cost per mile: $0.0012–$0.0018 (including retreading cost)
Result: higher tire cost, lower casing recovery value
With Systematic Tire Rotation
Drive → Steer (at 30% tread) → Trailer (at 20% tread) → Retreading eligible
Extended life per casing: 480K–600K miles
Casing recovery rate: 75–85%
Cost per mile: $0.0010–$0.0014 (5–22% reduction)
Result: lower cost, higher casing value, better environmental outcome
Seasonal Tire Strategies: Winter vs. Summer Inventory Management
Northern US transit systems face seasonal tire demand variation. Winter (November–March) demands higher tire replacement frequency due to cold-weather traction loss, salt damage, and tread wear acceleration. Summer (May–September) sees lower replacement frequency as conditions improve. A fleet in Minneapolis or Detroit might need 25–30 new/retread tires monthly in winter but only 12–15 in summer. This seasonal pattern drives inventory decisions: (1) pre-winter, accumulate 6–8 weeks of extra new tire inventory (purchase lead time buffer); (2) in winter, increase retread demand (fast-turnaround retreads provide availability buffer); (3) post-winter, reduce inventory and focus on casing accumulation for retreading; (4) in summer, run leaner new tire stock and delay retread orders. Strategic fleets reduce winter stockpile carrying cost by 15–25% through careful seasonal planning and vendor SLA negotiation (shorter lead times in summer allow lower inventory). Additionally, winter tire programs (different tread design for winter conditions) can be implemented selectively for northern routes while southern systems stick with all-season retreads year-round. The inventory optimization is sophisticated enough to warrant CMMS-based demand forecasting and automated ordering rules based on seasonal thresholds.
Seasonal Tire Demand (Northern Fleet, 100 Buses)
Seasonal Inventory Optimization Savings
CMMS-Integrated Tire Tracking: From Data to Decisions
Manual tire inventory management using spreadsheets or physical logs creates blind spots that lead to waste. A sophisticated fleet uses CMMS to track tires as individual assets: each tire has a record including serial number, size, position history, tread depth, maintenance history, and status (in service, awaiting retreading, retreaded, or scrap). When a tire is rotated or replaced, the transaction is logged in CMMS. Over 12 months, the CMMS database reveals: tire wear patterns by vehicle type, position, and season; average tire life by model bus; casing success rates (what percentage of removed tires are suitable for retreading); retread success rates (how long retreaded tires actually last); and total cost per mile by tire type and strategy. From this data, automated recommendations emerge: "Your 2012 articulated buses show 15% lower tire life than 2015 models; investigate suspension or driving practices." Or: "Summer casing quality is 8% better than winter; consider deferring questionable casings to retread until summer." Or: "Current retread supplier has 12% failure rate vs. 6% for competitor; negotiate or switch." CMMS-integrated tire tracking typically reduces annual tire cost 8–15% through these data-driven optimizations, beyond the cost reduction from retreading itself. The system also improves safety: tread depth alerts ensure tires are replaced before becoming unsafe, and systematic rotation ensures wear patterns are equalized.
CMMS Tire Analytics ROI — 24-Month Timeline (100-Bus Fleet)
ROI: 200–400%. Data-driven strategy replaces guesswork.
Fleet Tire Management Expert Review
Tires represent 12–20% of total fleet maintenance cost, making them a critical optimization target. The strategic levers are: (1) maximize casing reusability through disciplined inspection and retreading; (2) implement tire rotation to extend casing life 20–50%; (3) optimize retread inventory to balance cost and availability; (4) align seasonal strategy to demand variation; (5) use CMMS to track tire as assets and generate data-driven optimization recommendations. Fleets implementing all five strategies reduce tire cost 15–28% while improving safety and uptime. The ROI is substantial: a 100-bus fleet typically saves $25,000–$45,000 annually through optimized tire management, with payback in 8–16 months for CMMS implementation alone. BusCMMS includes dedicated tire management features: asset tracking, rotation scheduling, casing inventory management, retread optimization, wear pattern analysis, and seasonal forecasting. Most importantly, tire data is integrated with vehicle maintenance history, enabling root-cause analysis of unexpected tire failures and predictive maintenance interventions.
The Bottom Line
Tire cost is often treated as an unmanageable expense, but data-driven tire lifecycle management reduces cost 15–28% while improving safety and uptime. The strategy involves: maximize casing recovery through disciplined inspection and scheduled retreading; extend casing life through systematic tire rotation; optimize retread inventory for cost and availability; align seasonal strategy to demand variation; and use CMMS to track individual tires as assets and generate optimization recommendations. Implementation requires discipline and initial CMMS setup, but ROI is rapid (8–14 months) and ongoing benefits are substantial ($25,000–$45,000 annually for a 100-bus fleet). BusCMMS provides purpose-built tire management tools that integrate with fleet-wide maintenance data, enabling the holistic tire strategy that separates cost leaders from industry average operators. For fleet managers seeking to reduce cost without sacrificing safety or uptime, tire management is among the highest-ROI initiatives available.
Reduce Tire Cost 15–28%. Extend Casing Life 50–100%.
Strategic casing management, retread optimization, tire rotation, and seasonal forecasting cut tire expense while improving safety. CMMS-integrated tire tracking reveals wear patterns, predicts life expectancy, and automates reorder decisions. 100-bus fleets save $25K–$45K annually. Start your tire audit today.
Frequently Asked Questions
How much longer can a retread tire extend tire life?
What percentage of worn tires are suitable for retreading?
How much does a tire retread cost vs. a new tire?
Does tire rotation really extend casing life?
How should seasonal demand variation impact tire purchasing?
What should we track about tires to optimize cost?
Can we implement tire rotation without CMMS support?
How long does CMMS tire tracking take to break even?
Tire Lifecycle Strategy That Cuts Cost Without Sacrifice.
Casing management, retreading optimization, tire rotation, and seasonal planning reduce tire cost while improving safety. CMMS-integrated tire tracking reveals your true tire economy and automates optimization. Free 14-day trial.


