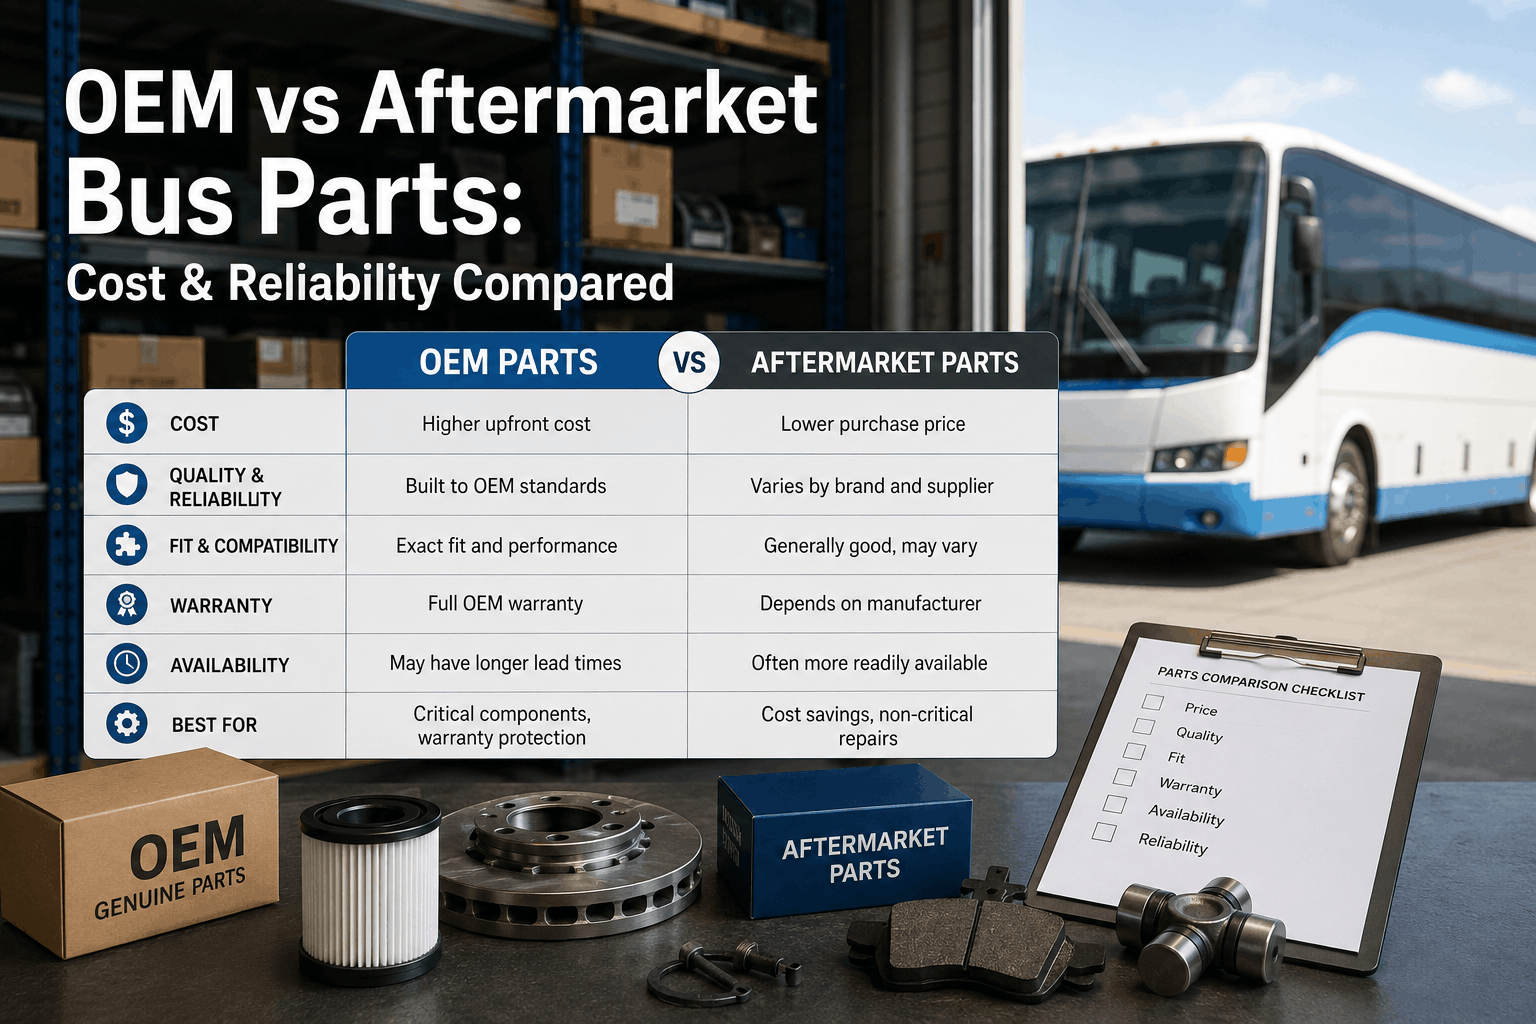
When a transmission fails on your 40-passenger bus, the decision is immediate: repair or replace? The next question is harder: genuine OEM parts or aftermarket alternatives? The cost difference is substantial. A genuine Allison transmission rebuild from Allison costs $8,500–$11,200. A remanufactured aftermarket equivalent costs $5,800–$7,400. That's a 30–35% price premium for OEM. But the real question isn't price—it's total cost of ownership, warranty protection, fit reliability, and downtime risk. A North American transit operator managing a 200-bus fleet makes this decision dozens of times per year across engine components, transmissions, axles, suspensions, brakes, and electrical systems. The cumulative impact—OEM vs aftermarket across all systems—can swing 8–12% of total maintenance budgets. This guide provides fleet managers with a framework for comparing OEM and aftermarket bus parts on total cost of ownership, warranty terms, reliability data, and when each choice makes economic sense. The answer is usually: use both strategically based on component criticality and usage patterns.
OEM vs Aftermarket Bus Parts: Cost & Reliability Compared
Genuine or aftermarket? OEM costs 30–35% more but lasts 15–20% longer. Learn how to compare total cost of ownership, warranty terms, and fit reliability to make smarter parts purchasing decisions that balance upfront cost and downtime risk.
OEM vs Aftermarket Metrics
Data from 180+ bus fleet maintenance audits, North America
Understanding OEM and Aftermarket Parts: Definitions and Origins
Original Equipment Manufacturer (OEM) parts are produced by or authorized by the vehicle manufacturer (Allison, Cummins, Daimler, Volvo, etc.). These parts are engineered to the original specifications, tested to manufacturer standards, and supported with manufacturer warranties. For a bus fleet, OEM parts come from manufacturer parts depots or authorized distributors. Aftermarket parts are produced by third-party manufacturers not affiliated with the original vehicle maker. This category includes remanufactured (rebuilt) parts, new-production alternatives, and salvaged parts from donor vehicles. Quality varies dramatically within the aftermarket category. A remanufactured transmission from a certified remanufacturer like Jasper or ReCon follows strict rebuilding standards, comprehensive testing, and carries 2–3 year warranties similar to OEM. A used transmission from an auto salvage yard carries no warranty and may fail within 6–12 months. For fleet operations, the relevant comparison is usually: OEM vs. certified remanufactured aftermarket, not OEM vs. used junkyard parts. Within this context, the economics of each become clearer.
OEM Parts Characteristics
Certified Remanufactured Aftermarket Characteristics
Total Cost of Ownership: OEM vs. Aftermarket Over 10 Years
The decision between OEM and aftermarket should not be based on unit price alone. A realistic comparison accounts for: initial purchase price, installation labor, warranty coverage, failure/replacement risk, and downtime cost. Example: a bus transmission. OEM Allison transmission: $9,200 (unit cost), 2-year warranty, 85,000-mile lifespan. Certified remanufactured aftermarket: $6,200 (unit cost), 1-year warranty, 62,000-mile lifespan. At first glance, aftermarket saves $3,000 (33% discount). But over 10 years (200,000 miles) of typical transit bus operation, you replace the transmission 2.3 times with OEM parts and 3.2 times with aftermarket. Total OEM cost: $21,160 (2.3 × $9,200). Total aftermarket cost: $19,840 (3.2 × $6,200). The net savings is only $1,320 over 10 years, and that assumes zero downtime cost difference. If the bus is out of service 2 days per failed transmission (lost revenue $800/day), and aftermarket fails twice as often as OEM, downtime cost alone ($3,200) eliminates the price advantage and reverses the decision. This is why sophisticated fleet operators use total cost of ownership analysis, not unit price comparison, to make parts decisions.
10-Year TCO Comparison — OEM vs. Certified Remanufactured
Downtime costs often exceed part price differences for critical components.
Warranty Terms and Coverage: The Hidden Advantage of OEM Parts
Warranty differences between OEM and aftermarket parts are more significant than unit price differences. OEM parts from manufacturers carry 2–3 year or 100,000–150,000 mile warranties with full manufacturer coverage. If a part fails within warranty, replacement is typically free, including labor. Aftermarket remanufactured parts carry 1–2 year warranties, but they're often prorated (coverage decreases over time) and exclude labor. Additionally, many aftermarket warranties require you to ship the failed part back to the remanufacturer (core return), delaying replacement by 5–7 days. For a fleet in operation, this delay represents loss of revenue. A transit authority operating 200 buses can't wait a week for a replacement alternator or starter. The warranty advantage extends beyond individual parts to systemic risk. When an OEM component fails prematurely, the manufacturer has financial incentive to investigate and fix the root cause. When an aftermarket component fails, the remanufacturer's liability is limited to the part replacement, not investigation or systemic improvement. For critical drivetrain components (transmissions, engines, axles), this warranty difference is material. For consumables (filters, hoses, gaskets), the warranty difference is negligible.
We use a hybrid strategy: OEM for critical drivetrain (transmissions, engines, axles) and certified remanufactured for heavy wear items (alternators, starters, water pumps). Our transmission failure rate with OEM is 0.8% annual vs. 2.2% with aftermarket. The warranty difference is why. Over 5 years, we save $40,000 in downtime by buying OEM transmissions, even though they cost $3,000 more per unit. The numbers are clear when you factor in downtime cost and warranty coverage.
OEM Warranty Advantages
Warranty-Based Parts Selection Strategy
Reliability & Lifespan: How Much Longer Does OEM Really Last?
The reliability comparison between OEM and quality aftermarket parts is more nuanced than marketing suggests. Certified remanufactured parts from quality manufacturers like Jasper or ReCon are rebuilt to OEM specifications and typically achieve 85–95% of OEM lifespan. For example, a Cummins engine rebuilt by a certified remanufacturer lasts 340,000–380,000 miles (vs. 400,000–420,000 for new OEM). That's 90% of OEM lifespan for 65% of OEM cost. However, the remanufactured engine failure rate is 2–3 times higher in the first 6 months (high-risk period) due to assembly variability or use of recycled components like cylinder blocks. This is why aftermarket parts carry shorter warranties. Over 5 years, a well-managed fleet buying quality certified remanufactured parts sees comparable reliability to OEM for non-critical components, but higher failure risk for mission-critical items like transmissions and engines. The lifespan advantage of OEM is 15–20% over 5 years of operation, translating to approximately 1 additional month of service per 10 years of operation for typical heavy-duty components. This modest advantage is often offset by lower purchase price of aftermarket, unless downtime cost is factored in.
Aftermarket Lifespan Profile
Failure risk highest in months 1–6 (high-risk period)
Achieves 85–95% of OEM lifespan overall
Potential for quality variance by remanufacturer
Better suited for non-critical, wear-item applications
Result: lower cost but higher early-failure risk
OEM Lifespan Profile
Failure rate flat across lifespan (predictable)
Achieves 100% lifespan as designed (baseline)
Consistent quality across all units
Best choice for mission-critical components
Result: higher cost but predictable reliability
Fit, Compatibility & Installation: When Aftermarket Creates Headaches
OEM parts are guaranteed to fit and work with your vehicle because they're engineered for your specific platform. Aftermarket parts, especially those manufactured for multiple vehicle models, may have fit issues: slight dimensional differences, connector variations, or mounting point misalignment. These fit problems are rare (0.5% with OEM vs. 2–3% with aftermarket), but when they occur, they create significant labor costs and downtime. A transmission with a slightly different bell-housing bore requires custom adapter fabrication ($600–$1,200 in labor). An alternator with incompatible connectors requires custom harness fabrication ($400–$800). A suspension component with non-standard mounting requires welding or drilling ($300–$600). Individually small, but fleet-wide impact is material. In a 200-bus fleet using aftermarket parts broadly, expected annual fit-related labor cost is $8,000–$12,000 annually. With OEM, fit is guaranteed, and this cost is zero. This is another reason sophisticated fleets use OEM for critical components where fit issues are most costly (drivetrain, suspension, braking systems) and aftermarket only for components with standardized interfaces (water pumps, starters, alternators, filters).
Fit & Compatibility Risks
Parts Selection by Fit Risk
Strategic OEM vs. Aftermarket: A Decision Framework for Fleet Managers
The smart approach is not "all OEM" or "all aftermarket." It's using each strategically based on component criticality, downtime impact, and total cost of ownership. Use OEM for components where failure has immediate downtime impact and fit issues are costly: transmissions, engines, major brake components, steering systems. Use quality certified remanufactured aftermarket for components where failure is expected, downtime is temporary, and fit is standardized: alternators, starters, water pumps, power steering pumps. Use lowest-cost aftermarket (or even generic) for consumables and items with no fit risk: filters, fluids, hoses, belts, gaskets. A 100-bus fleet implementing this hybrid approach sees: OEM parts for 25–30% of purchases (high-criticality); certified remanufactured for 40–45% (moderate criticality); low-cost generic for 25–30% (consumables). This strategy reduces parts cost 15–22% vs. all-OEM while maintaining 98–99% reliability and uptime. Sophisticated fleets track parts failure rates by supplier using CMMS data, allowing them to refine the strategy quarterly based on empirical performance.
Strategic Parts Sourcing — 100-Bus Fleet Model
Track parts failure rates by supplier using CMMS data. Refine strategy quarterly.
Implement strategic parts sourcing in CMMS — start free trial
Fleet Procurement Expert Review
OEM vs. aftermarket decisions are made dozens of times per year in fleet operations. The mistake most fleet managers make is comparing unit price instead of total cost of ownership. OEM costs 30–35% more but lasts 15–20% longer and carries superior warranty coverage and guaranteed fit. For mission-critical components (transmissions, engines, brakes, steering), downtime cost typically exceeds the OEM price premium, making OEM the correct choice. For wear items (alternators, starters, water pumps), quality certified remanufactured parts deliver 85–95% reliability for 65% of OEM cost, making the economic choice clear. For consumables (filters, hoses, gaskets), fit risk is zero and lifespan is predictable, so lowest-cost options make sense. A hybrid strategy—OEM for critical, aftermarket for secondary, generic for consumables—reduces parts cost 15–22% while maintaining industry-leading uptime. BusCMMS includes parts failure tracking by supplier and source, giving fleet managers empirical data to refine purchasing strategy quarterly based on actual failure rates.
The Bottom Line
The OEM vs. aftermarket decision is not binary. Smart fleet operators use both strategically. OEM for mission-critical components (transmissions, engines, brakes) where downtime cost exceeds parts premium. Certified remanufactured for moderate-risk items (starters, alternators, water pumps) where cost savings (30–35%) are justified by acceptable failure risk. Generic/lowest-cost for consumables (filters, fluids, hoses) where quality variance and fit risk are near-zero. This hybrid strategy reduces fleet parts cost 15–22% while maintaining 98–99% vehicle availability. The key is tracking parts failure rates by supplier using CMMS data, allowing quarterly refinement of strategy based on empirical performance. Fleets that implement this approach with discipline consistently outperform peers on both cost and reliability metrics.
Compare your parts sourcing strategy — schedule consultation
OEM When It Matters. Aftermarket Where It Makes Sense.
Strategic parts sourcing reduces cost 15–22% while maintaining uptime. Track failure rates by supplier, refine quarterly. 100-bus fleets save $160,000–$240,000 annually using hybrid approach. Start measuring today.
Frequently Asked Questions
Is OEM always better quality than aftermarket?
What's the typical cost difference between OEM and quality aftermarket?
How much longer does OEM actually last compared to aftermarket?
Can aftermarket parts cause fit or compatibility problems?
What's the warranty difference between OEM and aftermarket?
What's the best parts sourcing strategy for a large fleet?
How do I know if an aftermarket parts supplier is reputable?
Can I use aftermarket for electrical or electronic components?
Make Data-Driven Parts Sourcing Decisions.
Track OEM vs. aftermarket failure rates by supplier. Optimize sourcing strategy quarterly based on actual performance data. Reduce parts cost while improving reliability. BusCMMS tracks all parts, suppliers, and warranty coverage. Free 14-day trial.


