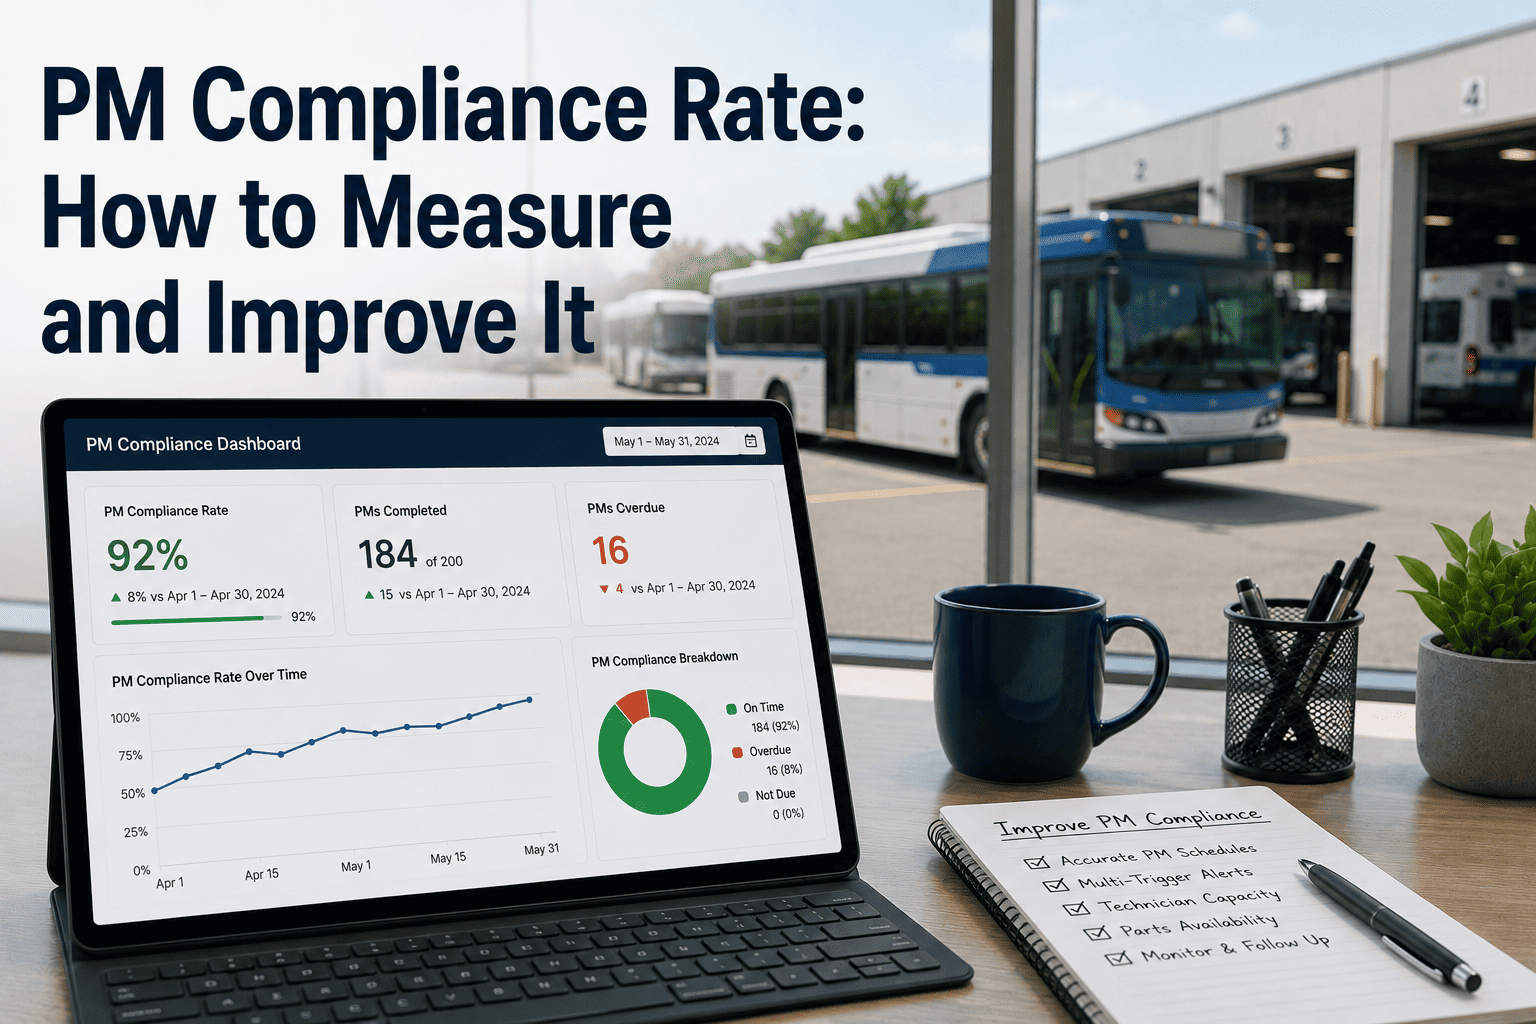
On-time preventive maintenance execution is the single most controllable cost driver in bus fleet operations. Yet most U.S. bus operators cannot accurately answer a simple question: "What percentage of our scheduled PM services are actually completed on time?" PM compliance rate—the fraction of scheduled maintenance that happens on schedule versus being deferred—is the difference between sustainable, profitable fleet operations and spiraling maintenance costs. The American Bus Association reports that fleets with 95%+ PM compliance spend 30–40% less annually on maintenance than fleets with 70% compliance. The difference between a fleet executing PM faithfully and one that habitually defers maintenance "just one more week" is often $300,000–$500,000 annually on mid-sized operations. This comprehensive guide teaches you how to calculate PM compliance rate accurately, set realistic but ambitious targets, identify systemic blockers preventing on-time execution, and implement process improvements that systematically improve compliance from 75% to 95%—unlocking $150,000–$300,000 in annual savings.
Deferred maintenance costs money. Learn to measure PM compliance, identify blockers, and improve from 75% to 95%—saving $200,000+ annually on 45-bus fleets.
PM Compliance Rate is calculated as: (Number of PM Services Completed On or Before the Due Date) ÷ (Total Number of PM Services Due in the Period) × 100. The math is straightforward; the execution is often sloppy.
Example Calculation: In January, your 45-bus fleet had 187 preventive maintenance services due (based on multi-trigger PM schedules). Of those 187 services, 181 were completed on time (on or before the due date). Compliance rate = 181 ÷ 187 × 100 = 96.8%. In February, 192 services were due and only 165 were completed on time. Compliance = 165 ÷ 192 × 100 = 85.9%. Your two-month average is (96.8 + 85.9) ÷ 2 = 91.35%.
The Definition of "On Time" requires precision: A PM service is on-time if it is completed on or before its due date. If a service is due January 15 and completed January 15 at 5 PM (last moment of the day), it's on-time. If it's completed January 16, it's deferred (overdue). No partial credit is given for "almost on-time." This strict definition has a purpose: deferred maintenance compounds. A service deferred by one week might make room for a different emergency repair that week; two weeks of deferral creates a backlog; three weeks creates panic scheduling. A hard due-date definition forces the organization to treat compliance as a hard constraint, not a soft guideline.
Measuring Compliance Requires Data Discipline: You must track three data points for every PM service: (1) scheduled due date (when was service supposed to happen?), (2) actual completion date (when was service actually completed?), (3) completion status (completed, skipped, deferred). Most spreadsheet-based maintenance tracking fails here because columns for "completion date" are often blank (work is in progress), or the dates are wrong (entered after the fact with poor accuracy). A CMMS like Bus CMMS automates this: when a technician marks a work order as complete in the system, the completion date is automatically recorded. When a work order passes its due date without completion, the system flags it as overdue. Compliance is calculated automatically.
Seasonality and Normalization: Fleet compliance naturally varies by season. Summer might show 95% compliance (good utilization, predictable schedules). Winter might drop to 80% (holiday disruptions, weather delays, seasonal school-bus slowdown). When analyzing compliance, compare month-to-month at the same season (January year 1 vs. January year 2) rather than January vs. December. Annual compliance trends are more meaningful than monthly snapshots.
Industry Standard: The American Bus Association recommends 95–98% PM compliance as the target for professional fleet operations. Below 90% indicates systemic failure. Above 98% is operationally difficult but possible with extraordinary discipline. Most well-managed U.S. fleets operate at 93–97% compliance.
Target by Fleet Maturity: - Reactive/Startup fleets (newly implementing PM): Target 85–90% in year 1. Accept that learning curve will involve missed services. Focus on trending upward. - Transitioning fleets (1–2 years into PM): Target 90–93%. Most processes are established; refine shop capacity and parts management. - Mature, optimized fleets (3+ years of PM discipline): Target 95–98%. This is achievable with strong processes, adequate staffing, and predictive scheduling.
Why Not 100% Compliance? Perfection is unattainable in operations. Legitimate obstacles arise: a parts order is delayed (bus can't be serviced without parts), emergency repairs take shop capacity (a transmission failure consumes the shop for days), a driver calls in sick (reduces available vehicle capacity), or weather prevents scheduled service (outdoor work impossible in ice storm). A target of 100% is demoralizing because it's unachievable, even for exceptional operators. A target of 95% is aspirational and achievable: it accounts for legitimate obstacles while still holding the organization accountable.
Setting Your Target: Assess your current baseline. If you're at 70% compliance, don't jump to 95% target. Set intermediate targets: 75% (month 1–2), 80% (month 3–4), 85% (month 5–6), 90% (month 7–12), 95% (ongoing). Each 5-percentage-point improvement requires work and delivers value. Don't set targets blindly; tailor them to your fleet's starting point and resource availability.
The Compliance Target Paradox: Higher compliance targets drive cost reduction, but only if you have the resources (shop capacity, parts availability, technician skill) to achieve them. Setting a 98% target when your shop can only handle 85% of PM workload creates frustration and failure. Compliance improvement must be paired with shop capacity expansion (hiring, outsourcing overflow) and parts management improvements (inventory optimization, vendor relationships). You can't target your way to improvement; you must invest to enable it.
Set compliance targets in Bus CMMS – see goal-tracking features
Improving compliance requires diagnosing why services slip in the first place. Most fleets have one or two dominant blockers that account for 60–70% of deferred services. Identifying and fixing these blockers delivers outsized returns.
Common Blocker #1: Parts Unavailability (40–50% of deferrals) A service is scheduled for Wednesday. The required part hasn't arrived yet. The service is pushed to Friday. Friday is consumed by emergency transmission repair. Service is rescheduled to next week. Next week, the part finally arrives, but the shop is booked. Eventually the service happens, 2–3 weeks late. The root cause: parts inventory management was reactive (order when service is scheduled) rather than proactive (order 4–6 weeks in advance based on forecast). Solution: Implement parts forecasting. For diesel buses, you know oil changes happen on a 20,000-mile cycle. Forecast how many oil changes you'll do in Q2, order 120% of that quantity in December, and guarantee parts availability. Bus CMMS includes parts forecasting tools that calculate future demand automatically.
Common Blocker #2: Shop Capacity Overload (25–35% of deferrals) You schedule 4 oil changes for Thursday. Wednesday evening, a bus breaks down mid-route with transmission failure. Transmission repairs require 2 full days of shop time. Thursday's PM schedule is instantly impossible. PM services are pushed to Friday and next week. This domino effect cascades. Solution: Maintain 10–15% shop capacity reserve. If your shop can perform 40 PM services per month, schedule only 34–36 and leave 4–6 slots for emergency repairs. This buffer prevents emergency work from destroying the PM schedule.
Common Blocker #3: Inadequate Shop Staffing or Skill Gaps (15–25% of deferrals) You have the parts and the capacity, but your technicians are unfamiliar with a new electric bus PM procedure. A routine battery diagnostic takes 4 hours instead of 2. The schedule slips. Solution: Cross-train technicians and invest in specialty training. Hire an electric-bus-certified technician if you're adding e-buses to your fleet. The cost of one specialist ($60K salary) is far less than the cost of chronic PM deferrals ($150K+ in hidden breakdowns).
Common Blocker #4: Inadequate PM Schedule (10–20% of deferrals) Your PM schedule is theoretically correct but practically overwhelming. A 45-bus fleet with 4.2 PM services per bus per month = 189 total services. If your shop can comfortably perform 170 services per month, compliance will naturally slide to 90%. Solution: Either reduce the PM schedule (eliminate low-value services), expand shop capacity, or reduce fleet size. Don't blame operators for failing to meet an impossible workload.
Common Blocker #5: Poor Visibility and Planning (10–15% of deferrals) No one knows which services are due next week until they're overdue. Technicians find out about services day-of, don't have parts ready, and defer. Solution: Predictive PM scheduling alerts (service flagged 14 days before due date, not 1 day before) and weekly compliance reviews (every Friday, check overdue services and remove blockers). Visibility prevents most compliance problems.
Forecast PM parts automatically – see Bus CMMS inventory module
Deferring planned maintenance doesn't save money; it moves cost from cheap (planned) to expensive (unplanned). A $200 planned oil change becomes a $2,800 emergency engine repair when the bus breaks down in service. This economics principle is why high-compliance fleets spend less on maintenance, not more.
Cost Differential: Planned vs. Unplanned Maintenance - Oil change (planned): $200 labor + $80 parts = $280. Scheduled during downtime window, minimal disruption. - Oil change (becomes emergency because deferred): Engine fails mid-route. $2,500 towing. $1,400 emergency repair labor. $800 parts (emergency markup). $15,000 lost revenue (bus out of service 3 days). Total cost: $19,700. Cost multiplier: 70x.
This isn't hypothetical. Every fleet operates with a 10–20% "failure rate" on deferred services: some portion of services that are deferred eventually result in the bus breaking down anyway, triggering the emergency pathway. A fleet deferring 16 PM services per month (85% compliance on 189 total) expects roughly 2–3 of those deferrals to cascade into emergency repairs. That's 24–36 emergency repairs per year that could have been prevented.
45-Bus Fleet Compliance Impact Analysis: - Scenario A (70% compliance): 57 services deferred per month, ~7 become emergencies = 84 emergency repairs/year × $8,000 avg cost = $672,000 emergency repair budget. Plus $240,000 in lost revenue from downtime. Total damage: $912,000. - Scenario B (95% compliance): 9 services deferred per month, ~1 becomes emergency = 12 emergency repairs/year × $8,000 = $96,000 emergency repair budget. Lost revenue negligible. Total damage: $96,000. - Difference: $816,000 annual savings (or cost avoidance) from improving 70% → 95% compliance.
This is the often-hidden economic driver of PM compliance. High-compliance fleets don't spend more on PM; they spend less on total maintenance because they prevent catastrophic failures. The opportunity cost of non-compliance is enormous.
We tracked compliance obsessively. Started at 68%. Within 18 months, we hit 94% through better parts forecasting, shop capacity planning, and weekly compliance audits. Our maintenance cost per bus dropped from $19,800 to $13,200. The 26-point compliance improvement directly saved us $304,000 annually. But the softer benefit—driver confidence that buses are reliable, passenger satisfaction from on-time service, reduced stress on dispatch from fewer breakdowns—that's been transformational for the whole operation.
How often should I measure and review PM compliance?
Weekly for overdue services (what's past due and needs immediate action), monthly for compliance trending (are we improving toward target?), and quarterly for deep-dive analysis (why did compliance slip in month 5? Parts shortage? Crew illness?). Real-time visibility prevents small problems from becoming systemic failures.
What's a realistic timeline for improving compliance from 75% to 95%?
90–180 days if you address major blockers systematically. Month 1–2: fix parts forecasting (gains ~8 points). Month 2–3: implement shop capacity buffer (gains ~5 points). Month 3–4: complete technician training (gains ~3–4 points). Total: ~16-point improvement over 120 days. Timeline depends on resource availability and blocker severity.
Should compliance targets vary by bus type (school, transit, charter)?
No. 95% compliance is the standard across all bus types. School buses, transit buses, and charter buses all require the same discipline. Some operational factors vary (school buses are seasonal, transit is 24/7), but the compliance target doesn't. Tailor your approach to the operational reality, not the target.
What's the relationship between compliance and uptime?
Direct and strong. Each percentage-point improvement in compliance adds roughly 1–1.5 percentage points of uptime (varies by fleet-specific emergency breakdown rate). A fleet moving from 75% to 95% compliance typically gains 15–20 percentage points of uptime, translating to 200–260 extra bus-days operational per month on a 45-bus fleet.
Can I improve compliance without CMMS software?
Yes, with strong discipline and spreadsheets, up to ~30 buses. Beyond that, manual tracking fails due to data entry errors and lack of real-time alerts. A CMMS like Bus CMMS is ROI-positive at 15+ buses because it eliminates human error and enables predictive scheduling (flagging due services 14 days early, not 1 day before).
How do I handle services that must be skipped due to parts obsolescence or bus retirement?
Don't count skipped services toward compliance. If a bus is retired, close out all its future PM work orders as "canceled—vehicle retired." If a part is obsolete and a service can't be performed, mark the work order as "canceled—part obsolete" and get executive approval. Compliance rate should only count achievable, legitimate services. Don't penalize yourself for genuinely impossible situations.
What if my shop's maximum capacity is 85% of the required PM workload?
Don't target 95% compliance; you'll fail. Either (1) expand shop capacity (hire, train, build), (2) reduce fleet size to match capacity, (3) reduce PM scope (eliminate low-value services), or (4) outsource overflow to third-party shops. Compliance targets must be realistic given resources. Set your target at 90% and work on capacity expansion to eventually reach 95%.
How does weather impact PM compliance, and should I account for seasonal variation?
Seasonal fleets (school, seasonal charter) see 5–10 percentage-point compliance swings between peak and off-peak. Winter weather can delay services by 3–7 days, impacting monthly compliance. Compare year-over-year at the same season; don't compare January to December. Set targets with seasonality in mind: "95% annual average, with 88–92% winter and 96–98% summer acceptable."
PM compliance rate is often treated as a secondary metric, overshadowed by uptime or cost-per-mile. In reality, compliance is the primary lever. You cannot achieve 95% uptime with 75% compliance. You cannot achieve 30% maintenance cost reduction with 80% compliance. Compliance is a lagging indicator of operational discipline: if your compliance is slipping, uptime will follow, costs will rise, and safety will be compromised. The best fleets don't achieve high uptime directly; they achieve it by obsessing over compliance. Track it, measure it weekly, publish it, and hold the organization accountable. The math is simple: better compliance = fewer emergency repairs = lower costs = higher uptime. It's not complicated; it just requires discipline.


