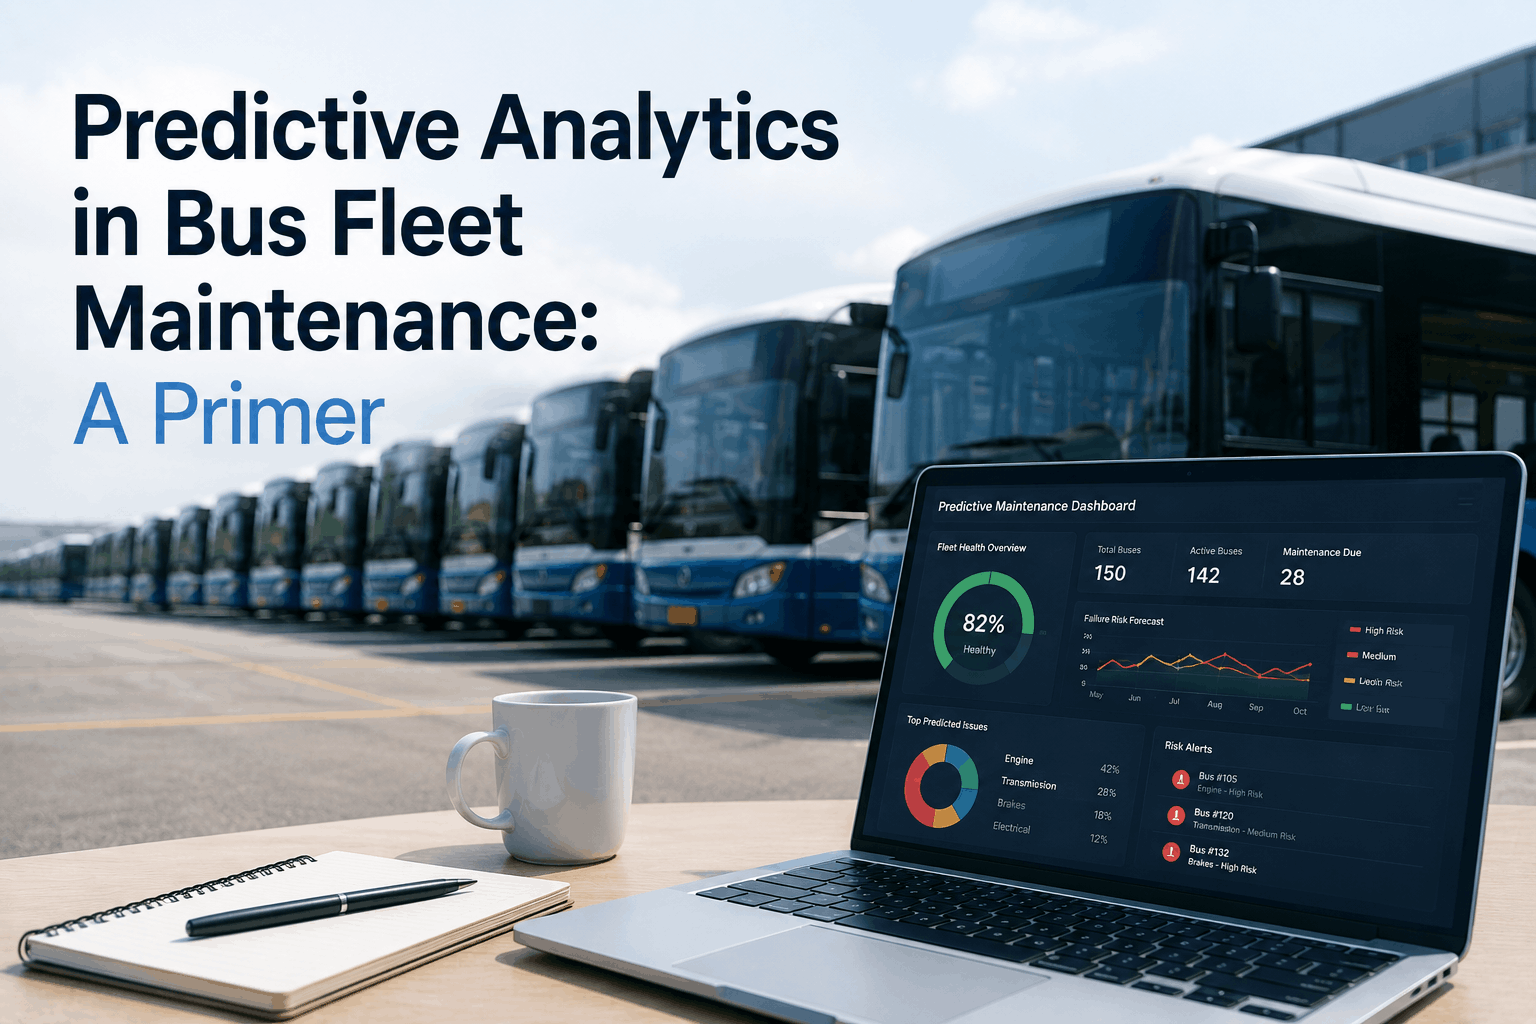
A 200-bus transit fleet in Chicago replaced reactive maintenance with predictive analytics. Before: breakdowns happened without warning. A bus would run fine at 6 AM, fail at 9 AM. Tow truck. Angry passengers. Rush repairs. Unscheduled downtime. After implementing predictive analytics: the system flagged Bus 147's air compressor three weeks before failure. Vibration patterns changed. Cycle times increased. The fleet scheduled the replacement during off-hours. Zero service disruption. $4,000 in planned repair vs $15,000 emergency repair. The difference is predictive analytics — using data to forecast failures before they happen. This guide explains what predictive analytics is, how it works for bus fleets, and how to get started.
Predictive Analytics 2026
3 weeks
Failure Warning Time with Analytics
Predictive analytics provides 2-4 weeks of warning before component failure — enough time to schedule repairs.
30-50%
Reduction in downtime
3-5x
ROI on predictive analytics
70%
Unplanned repairs preventable
What Is Predictive Analytics for Bus Fleets?
Predictive analytics uses historical data, real-time sensor readings, and machine learning algorithms to forecast when components are likely to fail. Unlike reactive maintenance (fix after failure) or preventive maintenance (fix on a schedule), predictive maintenance fixes components precisely when they show signs of impending failure. For bus fleets, predictive analytics analyzes: engine sensor data (temperature, pressure, vibration), telematics (speed, idle time, braking patterns), maintenance history (previous failures, repair quality), parts usage (lifecycle trends), and environmental factors (temperature, road conditions). The output is a risk score or estimated time to failure for each major component. Fleets then schedule repairs during planned downtime, not after roadside breakdowns.
1
Data Collection
Collect historical maintenance records, sensor data from CAN bus (engine, transmission, brakes), telematics data (usage patterns), and parts replacement history. More data = more accurate predictions.
2
Pattern Recognition
Machine learning algorithms identify patterns that precede failures. Example: air compressor cycle time increasing by 15% over 30 days preceded 90% of compressor failures. Algorithm learns this pattern.
3
Prediction & Alert
System continuously monitors real-time data. When patterns match pre-failure signatures, it generates an alert: "Bus 217 air compressor predicted to fail in 14-21 days. Confidence: 85%."
BusCMMS includes predictive analytics capabilities for component failure forecasting. Book a demo to see predictive analytics in action.
Reactive vs Preventive vs Predictive — What's the Difference?
Understanding the three maintenance strategies helps justify investment in predictive analytics.
ReactiveComponent failsAfter breakdown. Unplanned downtime. Emergency repairs.Highest — rush shipping, overtime, lost service hours
PreventiveFixed schedule (miles or time)On schedule. Planned downtime. Standard repairs.Medium — may replace components early (10-20% waste)
PredictiveData shows impending failureJust before failure. Planned downtime. Optimal timing.Lowest — replace only when needed, no premature replacements
Predictive analytics prevents the waste of preventive (replacing good parts) and the cost of reactive (emergency repairs). It's the optimal strategy.
A transit fleet tracked 50 air compressor failures over 2 years. Data analysis revealed: compressors showing a 15% increase in cycle time (time to build pressure) failed within 14-21 days with 92% accuracy. Fleet now gets alerts at 10% increase. They replace compressors during scheduled maintenance. Zero roadside air brake failures in 18 months. Average warning time: 18 days. Emergency repair cost (tow + rush parts + overtime): $8,000. Planned replacement cost: $2,500. Savings per failure: $5,500. Fleet has 200 buses, 15-20 compressor failures annually. Annual savings: $82,500-110,000.
What Components Can Predictive Analytics Forecast?
Predictive analytics works best on components with measurable degradation patterns. These are the highest-value targets for bus fleets.
Air Brake Components
Air compressors, brake chambers, slack adjusters, air dryers. Measurable: cycle time, pressure build rate, purge frequency. Predictable degradation over 2-4 weeks.
Engine Systems
Cooling system (thermostat, water pump, fan clutch). Measurable: temperature trends, coolant loss rate. Predictable degradation over 1-3 weeks.
Electrical Systems
Batteries, alternators, starters. Measurable: voltage drop under load, charging rate, cranking amperage. Predictable degradation over 2-6 weeks.
Emissions Systems (Diesel)
DPF differential pressure, EGR valve position, NOx sensor readings. Predictable degradation patterns over 4-8 weeks.
Electric Bus Components
Battery state of health (SOH) degradation rate, thermal management system pressure, charger performance. Predictable over months.
BusCMMS predictive analytics covers all major bus components with configurable alert thresholds. Sign up free to see predictive analytics for your fleet.
Data Requirements: What You Need to Get Started
Predictive analytics requires data — both quantity and quality matter. Here's what you need before starting.
1
Historical Maintenance Records (24+ months)
Work orders with failure dates, component replaced, repair type, parts used, labor hours. Digital records required. Paper records must be digitized. Minimum 50 failure events per component type for meaningful patterns.
2
Real-Time Sensor Data (CAN bus / Telematics)
Engine temperature, oil pressure, coolant temperature, battery voltage, alternator output, transmission temperature, air pressure, DPF differential pressure. Minimum 1 reading per hour. Ideally continuous.
3
Usage Data
Miles driven, engine hours, idle hours, average speed, route type (city vs highway), load factor, ambient temperature. Context matters for accurate predictions.
Fleets without 24 months of digital history can still start predictive analytics with simpler models. BusCMMS helps digitize paper records. Book a demo to assess your data readiness.
Implementation Roadmap: 6 Months to Predictive
Implementing predictive analytics is a journey. Here's a realistic 6-month roadmap for bus fleets.
Phase 1: Data CollectionMonth 1-2Digitize maintenance records. Install telematics on all buses. Connect CAN bus data feed. Establish baseline failure rates.
Phase 2: Pattern AnalysisMonth 3Identify historical failure patterns. Calculate component mean time between failures (MTBF). Determine lead indicators (what data changed before failure).
Phase 3: Alert RulesMonth 4Configure alert thresholds for each component. Start with simple rules (e.g., "alert if coolant temperature > 215°F for 15 minutes"). Test on pilot buses.
Phase 4: Machine LearningMonth 5-6Train ML models on 24+ months of data. Validate predictions against recent failures. Deploy to full fleet.
Start with one component type (e.g., air compressors or cooling system). Expand to other components after success. Don't try everything at once.
Predict Failures Before They Happen.
Predictive analytics for bus fleets — air brakes, cooling, electrical, emissions, batteries. Reduce downtime 30-50%. Free 14-day trial.
Common Predictive Analytics Models for Bus Fleets
Different components require different prediction models. Here are the most common approaches.
Regression-Based Prediction
Predicts exact time to failure based on continuous data trends. Best for: battery SOH degradation, compressor cycle time increase, coolant temperature drift. Output: "Expected failure in 14 days."
Classification Models
Predicts probability of failure within time window (e.g., "85% chance of failure within 30 days"). Best for: engine failures, transmission issues, emissions system faults.
Anomaly Detection
Flags when sensor readings deviate from normal patterns. Best for: unexpected failures without clear degradation pattern. Less specific but catches novel failure modes.
BusCMMS uses ensemble modeling combining all three approaches for maximum accuracy. Sign up free to see prediction models.
ROI of Predictive Analytics for Bus Fleets
Calculate your potential return on investment using these metrics.
Reduced emergency repairs$40,000–80,00015-20 failures annually × $2,000-4,000 savings per failure
Lower towing costs$10,000–20,000Tow + after-hours service + missed route penalties
Extended component life$15,000–30,000Replace at optimal time vs premature or post-failure
Reduced downtime labor$20,000–40,000Emergency overtime labor (1.5-2x standard rate)
Total Annual Savings$85,000–170,000Typical ROI: 3-5x annual software cost
Predictive analytics software typically costs $15,000-30,000 annually for a 100-bus fleet. ROI period: 3-6 months.
"We implemented predictive analytics for cooling system failures. The algorithm flagged Bus 089's water pump 17 days before failure based on coolant temperature fluctuation patterns. We replaced the water pump during scheduled PM. Cost: $600 part, 3 hours labor. Without prediction: tow from highway ($1,200), emergency repair at dealer ($2,800), engine damage from overheating ($4,500 estimate — avoided). Total avoided cost: $8,500. In the first year, the system predicted 8 cooling failures. That's $68,000 in avoided costs. The software paid for itself in two months." — Fleet Maintenance Director, 150-bus transit agency, Washington
Frequently Asked Questions
What is predictive analytics in fleet maintenance?
Predictive analytics uses historical data, real-time sensor readings, and machine learning to forecast when components are likely to fail, allowing repairs to be scheduled before breakdowns occur.
How accurate are predictive analytics for bus fleets?
For well-modeled components with sufficient data (e.g., air compressors, cooling systems), accuracy of 85-95% is achievable. Newer components with less data have lower accuracy that improves over time.
What data is needed for predictive analytics?
24+ months of maintenance records, real-time sensor data (CAN bus, telematics), and usage data (miles, hours, routes). More data = more accurate predictions.
Can predictive analytics work for older buses without CAN bus data?
Yes — with limitations. Older buses can use maintenance history and periodic inspections for simpler models. Retrofitting sensors is possible for high-value components.
Does BusCMMS include predictive analytics?
Yes. BusCMMS predictive analytics covers air brakes, cooling systems, electrical components, diesel emissions systems, and electric bus batteries with configurable alert thresholds.
How long does it take to implement predictive analytics?
3-6 months for full implementation: data collection (1-2 months), pattern analysis (1 month), alert rules (1 month), machine learning model deployment (1-2 months).
Stop Fixing Failures. Start Predicting Them.
Predictive analytics for bus fleets. Air brakes, cooling, electrical, emissions, batteries. Reduce downtime 30-50%. Free 14-day trial.