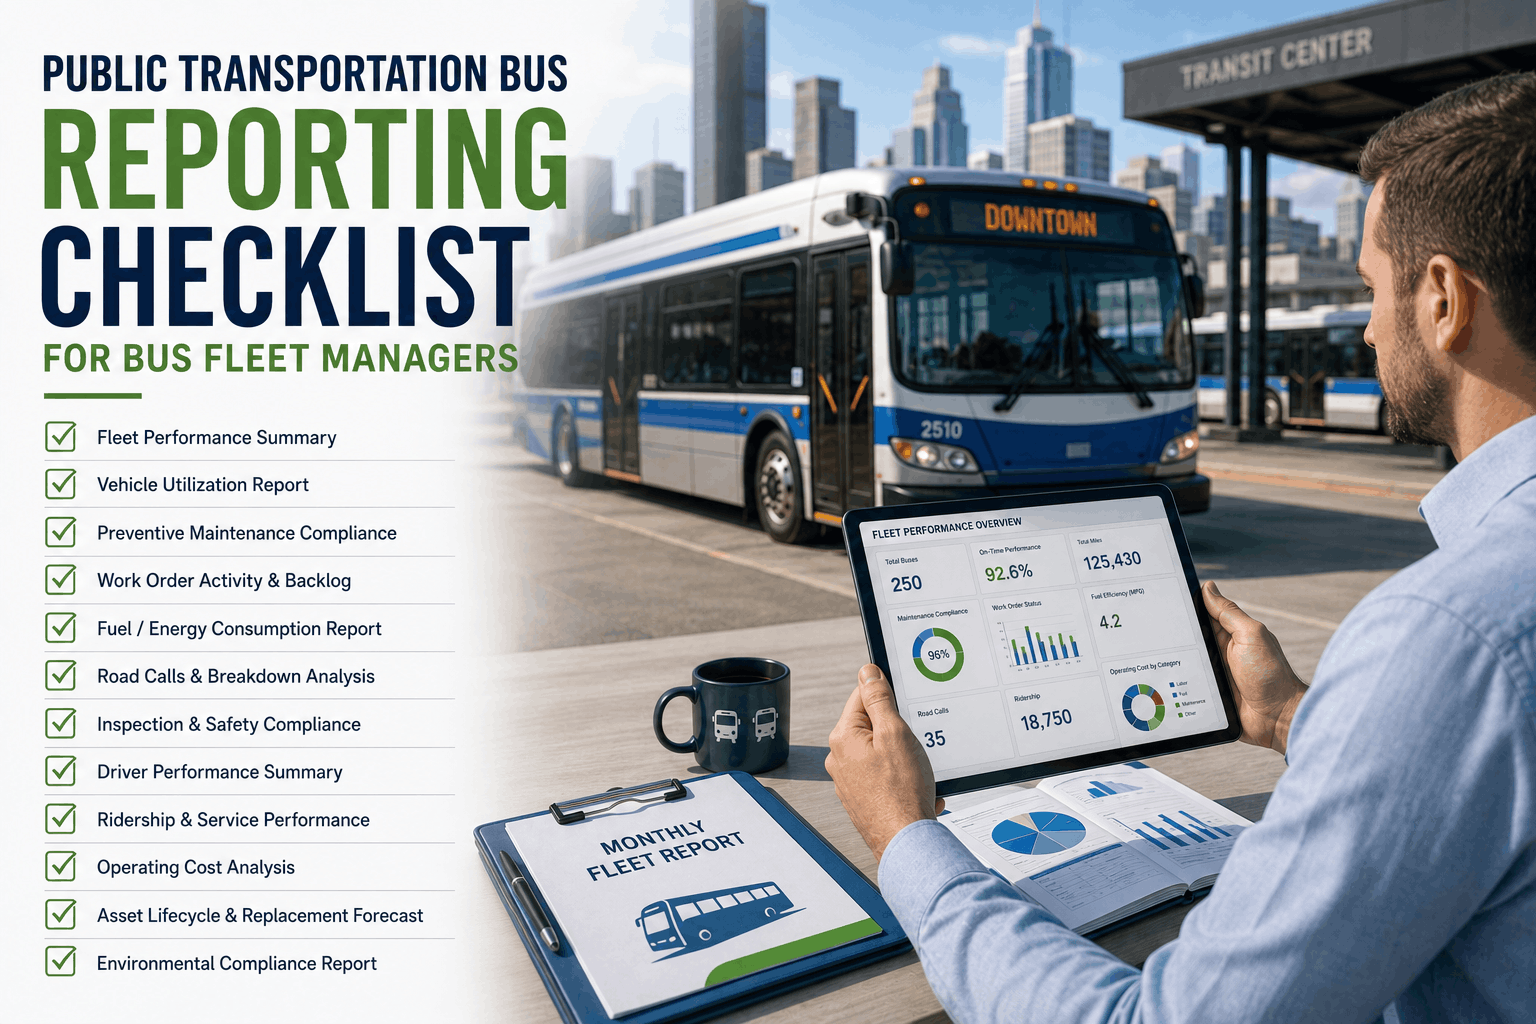
Public Transportation Bus Reporting Checklist for Bus Fleet Managers


blogpublic-transportation-bus-reporting-checklist-for-bus-fleet-managers

Public transportation bus reporting is not just about filling out forms. For transit agencies, reporting connects maintenance performance, safety compliance, grant funding, budget justification, and service reliability to leadership, boards, and oversight bodies. A transit fleet that cannot produce clear reports on vehicle availability, maintenance cost per mile, PM compliance, breakdown frequency, parts inventory turns, and technician productivity creates operational blind spots and audit risk. Spreadsheets, disconnected databases, and paper records are not enough when FTA triennial audits, state DOT reviews, or board presentations demand clean, traceable data. In 2026, effective public transportation reporting means having on-demand access to maintenance KPIs, compliance status, lifecycle costs, and exception reports — all tied to specific vehicles, drivers, and work orders. This page explains how transit fleets can use connected CMMS workflows to improve reporting efficiency, reduce manual effort, and strengthen decision-making.

Transit Reporting 2026
Public Transportation Bus Reporting Checklist for Bus Fleet Managers

Discover how leading fleets manage public transportation bus reporting using data, automation, and standardized operating procedures.

Reporting Snapshot
Report generation time (manual)2-3 weeks
Report generation time (CMMS)Under 30 seconds
KPIs tracked daily8 essential metrics
Audit preparation time reduction90%+ achievable
Transit reporting connects maintenance, compliance, budget, and service reliability into one auditable record.
01The Core Transit Reports Every Fleet Must Produce

Public transportation fleets operate under multiple reporting requirements. Internal reports support daily operations and maintenance planning. External reports satisfy FTA, state DOT, and local oversight requirements. Leadership reports justify budget and demonstrate performance. The core reports include vehicle availability (percentage of fleet ready for service), maintenance cost per mile (total operating cost divided by miles), PM compliance (percentage of PMs completed on time), breakdown frequency (road calls per 10,000 miles), MTBF and MTTR, parts inventory turnover, warranty recovery rate, and technician productivity. Each report should be available on demand, filterable by time period, vehicle, route, or cost center, and exportable to standard formats for auditors and board members.

Transit Reporting Priorities by Stakeholder
Report priority
35% Maintenance KPIs
30% Compliance status
20% Financial reports
15% Service reliability
02The 8 Essential Transit Reports Every Fleet Manager Needs

A transit reporting framework should include eight essential reports that cover maintenance performance, financial health, compliance status, and service reliability. These reports should be available on demand, updated in real time, and exportable for auditors and leadership.

Vehicle availability reportPercentage of fleet ready for service daily, weekly, monthly. Tracks pullout reliability and downtime causes.
Maintenance cost per mile reportTotal operating cost divided by miles driven. By bus, by route, by month. Flags cost outliers immediately.
PM compliance reportPercentage of PMs completed on time. By bus, by shop, by month. Predicts future breakdown risk.
Breakdown analysis reportRoad calls per 10,000 miles. By bus, by component, by cause. Identifies chronic failure patterns.
MTBF and MTTR reportMean time between failures and mean time to repair. By bus, by component, by technician. Measures reliability and maintainability.
Parts inventory reportTurnover rate, dead stock percentage, stockout frequency, reorder status. Optimizes inventory investment.
Warranty recovery reportClaims submitted, approved, denied, pending. Recovery percentage by component, by vendor. Recovers lost revenue.
Technician productivity reportWork orders completed, MTTR by technician, schedule compliance, overtime percentage. Identifies training needs.
03How Connected Data Improves Transit Reporting Accuracy

Reporting accuracy depends on data quality. If fuel transactions are missing odometer readings, cost per mile reports are unreliable. If PM completion dates are recorded inconsistently, PM compliance reports are inaccurate. If work order labor hours are estimated instead of logged, technician productivity reports mislead. Connected CMMS systems improve reporting accuracy by enforcing data completeness at the point of entry: mandatory fields for work orders, odometer validation for fuel transactions, timestamp capture for PM completions, and role-based access to prevent unauthorized changes. The result is reports that managers and auditors can trust.

Reporting Accuracy Before and After Connected CMMS
Jan Mar May Jul Sep Nov
Data errors before CMMS Data errors after CMMS implementation
04Reporting KPIs Transit Managers Should Track Weekly

Reporting improves when managers review the right metrics on a consistent schedule. Daily reports focus on vehicle availability and safety defects. Weekly reports focus on PM compliance, work order backlog, and parts availability. Monthly reports focus on cost per mile, breakdown trends, and warranty recovery. Quarterly reports focus on lifecycle analysis, asset replacement planning, and vendor performance.

Vehicle availabilityDaily
PM complianceWeekly
Work order backlogWeekly
Cost per mileMonthly
Breakdown frequencyMonthly
Warranty recoveryQuarterly
05Common Transit Reporting Mistakes and How to Fix Them

Most transit reporting failures come from data gaps, not bad analysis. Missing odometer readings make cost per mile unusable. Inconsistent PM completion dates make compliance reports unreliable. Unlogged technician hours make productivity reports misleading. The fix is not better spreadsheets — it's enforcing data completeness at the source. A CMMS that requires odometer entry for every fuel transaction, timestamps every PM completion, and logs actual labor hours against work orders creates clean data that reports can trust.

Missing odometer readingsRequire odometer entry at every fuel transaction. Flag and follow up on missing entries weekly.
Inconsistent PM completion datesAuto-timestamp PM completions. Prevent backdating without approval trail.
Unlogged technician hoursRequire labor hour entry on every work order. Compare to estimated hours. Investigate variances.
Manual cost per mile calculationsAutomate cost per mile from fuel card and odometer data. Review exceptions weekly.
Spreadsheet-based reportingMove all reports to CMMS with on-demand export. Eliminate manual data consolidation.
No exception alertsConfigure alerts for MPG drops, PM overdues, and parts stockouts. Review daily.
A 150-bus transit agency reduced monthly reporting time from 3 days to 2 hours after implementing a connected CMMS with automated report generation. The biggest gains came from automated cost per mile calculations, PM compliance dashboards, and parts inventory reports. The agency now provides weekly performance updates to leadership instead of quarterly summaries, and audit preparation dropped from 4 weeks to 2 days.
— Transit Maintenance Manager, 150-bus fleet
Transit Reporting Expert Takeaway

Public transportation reporting is strongest when data is captured at the source, validated automatically, and made available through configurable dashboards. The eight essential reports — vehicle availability, cost per mile, PM compliance, breakdown analysis, MTBF/MTTR, parts inventory, warranty recovery, and technician productivity — should be available on demand, updated in real time, and exportable for auditors and leadership. Fleets that treat reporting as a daily operational tool instead of a monthly exercise improve decision-making, reduce audit risk, and lower operating costs.

The Bottom Line

Improving public transportation bus reporting requires moving from manual spreadsheets to automated CMMS workflows. The essential reports — vehicle availability, cost per mile, PM compliance, breakdown frequency, MTBF/MTTR, parts inventory, warranty recovery, and technician productivity — should be available on demand. Weekly KPI reviews catch problems before they become crises. Connected data systems ensure reporting accuracy by enforcing data completeness at the source. Transit fleets that make this transition reduce reporting time by 90%, improve data accuracy, and strengthen audit readiness.

Improve Public Transportation Bus Reporting
Vehicle availability, cost per mile, PM compliance, breakdown analysis, MTBF/MTTR, parts inventory, warranty recovery — all in one connected CMMS platform.
Frequently Asked Questions
What are the most important transit fleet reports?
The eight essential reports: vehicle availability, maintenance cost per mile, PM compliance, breakdown frequency, MTBF/MTTR, parts inventory turnover, warranty recovery rate, and technician productivity.
How often should transit fleet reports be generated?
Vehicle availability and safety defects: daily. PM compliance and work order backlog: weekly. Cost per mile and breakdown trends: monthly. Lifecycle analysis and warranty recovery: quarterly.
What is a good cost per mile for a transit bus?
Transit bus total operating cost per mile: excellent $1.10-1.35, good $1.35-1.65, needs improvement $1.65-2.00, poor $2.00+. Actual varies by region, fuel price, and fleet age.
How does a CMMS improve transit reporting?
A CMMS automates data capture from fuel cards, work orders, inspections, and parts inventory, then generates on-demand reports with real-time accuracy, eliminating manual data consolidation.
What is a good PM compliance target for transit fleets?
Target 95% or higher. Below 90% increases breakdown risk significantly. Below 85% guarantees frequent breakdowns and higher operating costs. Track PM compliance weekly.
How long does audit preparation take with a CMMS?
Audit preparation with a connected CMMS typically takes 1-2 days — a 90-95% reduction from manual preparation (2-4 weeks). Reports are exportable in under 30 seconds.
Public Transportation Bus Reporting — Complete Guide
Vehicle availability, cost per mile, PM compliance, breakdown analysis, MTBF/MTTR, parts inventory, warranty recovery, technician productivity. Everything transit fleets need for better reporting.


Share This Story, Choose Your Platform!
