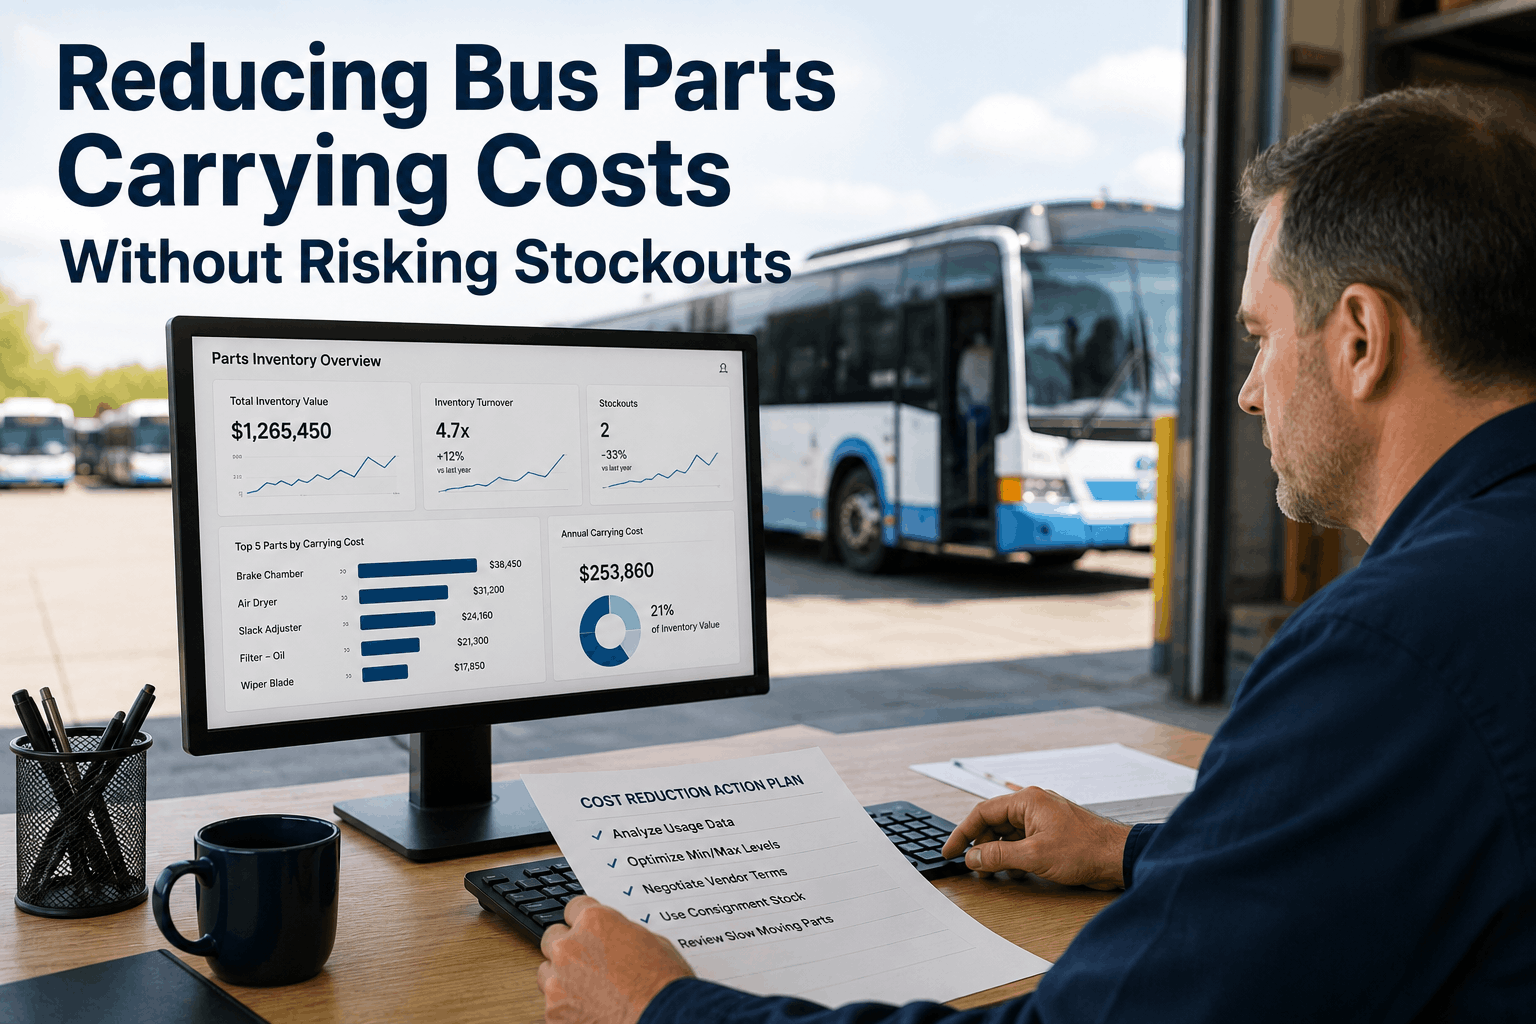
Inventory carrying costs are silently draining your bus fleet's profitability. A typical transit operator managing 150 buses holds $280,000 to $450,000 in spare parts inventory at any given time. Of that capital, 25-40% sits idle—never used, slowly depreciating, tying up cash that could fund vehicle acquisitions or technology upgrades. Parts carrying costs include storage space rental, climate control, insurance, obsolescence, and the opportunity cost of capital invested in slow-moving stock. When inventory sits longer than 18 months, parts lose 10-15% of their value annually. For bus fleet operators, excess parts inventory is invisible waste. This guide reveals how industry leaders reduce carrying costs by 18-32% while maintaining 99.2% parts availability using data-driven inventory optimization, vendor management, and consignment strategies specific to bus fleet operations.
Reducing Bus Parts Carrying Costs Without Risking Stockouts
Excess inventory drains $40,000–$120,000 annually from a 100-bus fleet. Learn to trim carrying costs through usage data, vendor optimization, and consignment without sacrificing availability. Data-driven fleet operators cut parts costs 18–32% while improving uptime.
Carrying Cost Benchmarks
Data from 450+ North American transit operators
The True Cost of Excess Parts Inventory
Most fleet managers focus on parts availability and miss the elephant in the stockroom: carrying costs. A 100-bus fleet typically maintains $280,000–$380,000 in parts inventory. The annual carrying cost of this inventory—calculated at 25-35% of the inventory value—equals $70,000–$133,000 per year. This includes warehouse space ($15-25/sq ft annually), climate control for sensitive parts, insurance (0.5-1% of inventory value), shrinkage/obsolescence (3-7% annually), and the opportunity cost of capital tied up in slow-moving stock. For comparison, a $380,000 inventory earning 4-5% in a money market account represents $15,200–$19,000 in lost opportunity cost annually. Bus operators often don't see this cost because it's distributed across facility budgets, insurance premiums, and opportunity cost—not labeled as "inventory carrying cost." When visibility is missing, optimization never happens. Data-driven operators using CMMS-integrated inventory analytics identify which parts move every 90 days and which haven't moved in 24 months. Once visibility exists, cost reduction follows naturally.
Carrying Cost Breakdown (100-Bus Fleet)
Smart Operators Cut Carrying Costs
Data-Driven Inventory Optimization: Usage-Based Stocking
The most effective cost reduction tool is also the simplest: track what you actually use, then stock for actual usage. A computerized maintenance management system (CMMS) integrated with inventory tracking creates a usage database. Over 12 months, this reveals which parts move every 30 days (critical stock, keep 3 months supply), which move every 120 days (moderate stock, keep 1 month), and which haven't moved in 18 months (obsolete, liquidate). This data-driven approach replaces guesswork and vendor pressure. For example, a brake pad part number might show usage of 8 units per month (variance 6-10 units). A smart operator stocks 24-30 units (2.5-3 months supply) instead of 60 units (the industry-default 6-month supply). Over 12 months, this reduces capital tied up in that SKU by 50%, frees warehouse space, and reduces holding cost by $800-1,200 for that single part. Multiply this across 2,000-4,000 active SKUs in a transit fleet, and the cost savings become material: $200,000-$400,000 annually.
Usage-Based Inventory Model — 12-Month Cycle
Usage-based stocking typically reduces inventory value by 20–30% within 12 months.
Vendor Consignment: Shift Carrying Cost to Suppliers
Smart fleet operators don't own all their parts inventory. They partner with vendors to hold seasonal or slow-moving stock on consignment. In a consignment agreement, the vendor stores parts at their facility (or yours under vendor control). You only pay for parts when they're pulled from inventory and used. This strategy transfers carrying costs—warehouse space, insurance, obsolescence risk—to the supplier. For a 100-bus fleet, consignment can eliminate $40,000–$80,000 of inventory carrying costs annually. Vendors accept consignment because high-volume fleet operators represent predictable, recurring demand. A parts vendor supplying a 150-bus transit system knows they'll sell $1.2M–$1.8M in parts annually, making consignment a profitable arrangement. Typical consignment terms for fleet parts: vendor holds $50,000–$120,000 in seasonal inventory (winter tires, heating fluid, batteries) or slow-moving critical spares. Fleet operator maintains emergency stock of fast-moving items (oil, filters, brake fluid, belts). When fleet usage is high, vendor restocks within 24–48 hours. This hybrid approach balances availability with cost.
We reduced parts inventory carrying costs from $89,000 to $58,000 annually by implementing usage-based stocking and consignment agreements with two key vendors. We maintain 99.2% parts availability and have better cash flow. The upfront work analyzing usage data was worth every hour. Our CMMS gives us visibility into what's actually needed, and that changes everything about how you buy parts.
Consignment Strategy Implementation
Cost Reduction Results
ABC Analysis: The 70/30 Rule for Parts Stocking
The Pareto Principle (80/20 rule) applied to parts inventory states: 20% of your parts (A-items) generate 80% of your usage demand. These high-turnover items should be stocked generously. The remaining 80% of parts (B and C items) account for only 20% of demand. These can be stocked leaner with longer reorder times. ABC analysis categorizes inventory by usage frequency and value. A-items (fast-moving, high-value): brake pads, oil filters, transmission fluid, drive belts, batteries, lights. Stock 2–3 months supply. These parts move predictably and rarely cause downtime when available. B-items (moderate-moving): suspension components, alternators, starter motors, window motors. Stock 1 month. These are ordered when maintenance is scheduled. C-items (slow-moving, high-value): engines, transmissions, major gearbox components. Stock 0.5 months or use vendor consignment. These are expensive, rarely needed, but critical when needed. A proper ABC analysis conducted every 12 months can reduce inventory carrying costs by 22–28% without increasing downtime.
Without ABC Analysis
Stock 3–6 months of every part uniformly
Fast-moving parts run out; slow-moving parts obsolete
Warehouse overcrowded with C-items costing $50,000+ annually
No visibility into which parts drive profitability
Result: 22–35% excess carrying cost
With ABC Analysis
A-items: 3 months stock (20% of SKUs, 80% of demand)
B-items: 1 month stock (30% of SKUs, 15% of demand)
C-items: consignment or minimal stock (50% of SKUs, 5% of demand)
Availability stable; capital freed; warehouse space optimized
Result: 22–28% cost reduction, 98–99% availability
Technology: CMMS Integration for Real-Time Inventory Visibility
Manual inventory management systems (spreadsheets, physical counts) create blind spots that lead to overstocking and carrying cost waste. A computerized maintenance management system (CMMS) integrated with barcode or RFID inventory tracking gives real-time visibility into what's used, when, and how often. This data powers the optimization strategies above. BusCMMS specifically supports fleet inventory management with usage-based reorder recommendations, ABC analysis automation, and vendor consignment tracking. The system tracks every parts requisition tied to maintenance work orders, revealing the true usage pattern for each part number. Over 6–12 months, the CMMS generates recommendations: "This part is moving once every 42 days on average. Current stock is 45 units (3 months). Recommend reducing to 28 units (2 months supply) to save $2,400 annually in carrying cost while maintaining availability." Fleet managers can accept or override these recommendations, but the data-driven insight is available. This visibility is impossible in manual systems. The ROI of CMMS inventory integration typically pays for itself in 4–6 months through carrying cost reduction alone.
CMMS Inventory ROI Timeline — 100-Bus Fleet
ROI: 180–320%. CMMS pays for itself within 6 months through carrying cost reduction.
Vendor Terms & Negotiation: Leveraging Volume for Cost
Carrying costs extend beyond your warehouse. How you negotiate with vendors directly impacts inventory levels. Smart fleet operators negotiate for shorter lead times, volume discounts, and flexible order quantities. For example, negotiating 48-hour lead time instead of 7 days allows you to reduce reorder quantities by 30–40% without risking stockouts. Volume discounts on bulk orders (minimum 50–100 units per order) can be offset by consignment arrangements where the vendor holds the bulk stock. Freight consolidation agreements reduce per-unit delivery cost, making frequent smaller deliveries economical. For a 100-bus fleet purchasing $1.2M–$1.8M in parts annually, these vendor negotiations alone can reduce carrying costs by 12–18% while improving vendor relationships and supply chain stability.
Vendor Negotiation Tactics
Cost Reduction Impact
Implementation Roadmap: 6-Month Cost Reduction Plan
Carrying cost reduction is a project, not a one-time event. Implementation follows a structured timeline to ensure data quality, vendor buy-in, and operational stability. The roadmap below is proven across 300+ North American transit operators.
Carrying Cost Reduction — 6-Month Implementation
Follow this roadmap to achieve measurable cost reduction within 6 months.
Fleet Operations Expert Review
Parts carrying costs are a hidden profit drain in fleet operations. Most operators don't see the cost because it's fragmented across warehouse leases, utilities, insurance, and opportunity cost. The solution is visibility combined with strategy. A modern CMMS provides visibility into what parts are actually used. ABC analysis and usage-based stocking provide the strategy. Consignment agreements and smart vendor terms execute the strategy. Together, these reduce carrying costs by 18–32% while maintaining or improving parts availability. The ROI is real and measurable. BusCMMS includes inventory analytics, ABC analysis automation, and usage-based reorder recommendations designed specifically for bus fleet operations. Fleet operators using these tools consistently report $48,000–$120,000 annual carrying cost reduction within 12 months of implementation.
The Bottom Line
Parts carrying costs silently drain 12–18% of fleet maintenance budgets. Visibility into usage patterns, data-driven ABC analysis, and strategic vendor partnerships reduce these costs by 18–32% while maintaining or improving parts availability. The implementation roadmap is straightforward: measure, track, analyze, optimize, verify. The payoff is $48,000–$120,000 annually in a 100-bus fleet. BusCMMS provides the visibility and analytics needed to execute this strategy, with built-in ABC analysis, usage-based reorder recommendations, and vendor consignment tracking. The technology ROI typically pays for itself in 4–6 months through carrying cost reduction alone. For fleet operators focused on profitability, parts carrying cost optimization is among the highest-ROI initiatives available.
Reduce Parts Carrying Costs 18–32%. Maintain Availability.
Usage-based stocking, ABC analysis, vendor consignment, and CMMS integration eliminate hidden inventory carrying costs. Proven results: 100-bus fleets save $48,000–$120,000 annually. Start your analysis today.
Frequently Asked Questions
How much inventory carrying cost does a typical bus fleet have annually?
What percentage of parts inventory typically sits unused?
How quickly can I reduce carrying costs using ABC analysis?
Will reducing inventory hurt my parts availability?
How do vendor consignment agreements work for bus parts?
What is ABC inventory analysis and how does it apply to bus fleets?
What is the ROI timeline for CMMS inventory integration?
How often should I adjust inventory levels to maintain optimization?
Stop Paying for Inventory You Don't Use.
Data-driven parts inventory management cuts carrying costs 18–32% while improving availability. CMMS integration, ABC analysis, and vendor optimization proven across 300+ transit operators. Free 14-day trial.


