A rural school district in Missouri with 45 buses tracked every maintenance dollar for five years. In 2020, they spent $4,200 per bus annually. In 2023, with buses three years older, that number climbed to $5,800 per bus. By 2025, with their oldest buses hitting 15 years, costs reached $7,400 per bus — a 76% increase over five years. The superintendent asked the transportation director: "Is this normal?" The answer: yes and no. Older buses cost more to maintain — that's normal. But without benchmarking, the district didn't know if they were spending average, above average, or below average. They didn't know if their cost per bus was $2,000 higher than neighboring districts. They couldn't justify their budget to the school board. This guide provides 2026 school bus maintenance cost data by bus age, fuel type, and fleet size. Use it to benchmark your fleet, build budgets, and justify maintenance investment.
Benchmark by bus age, fuel type, and fleet size. Build accurate budgets. Justify maintenance investment.
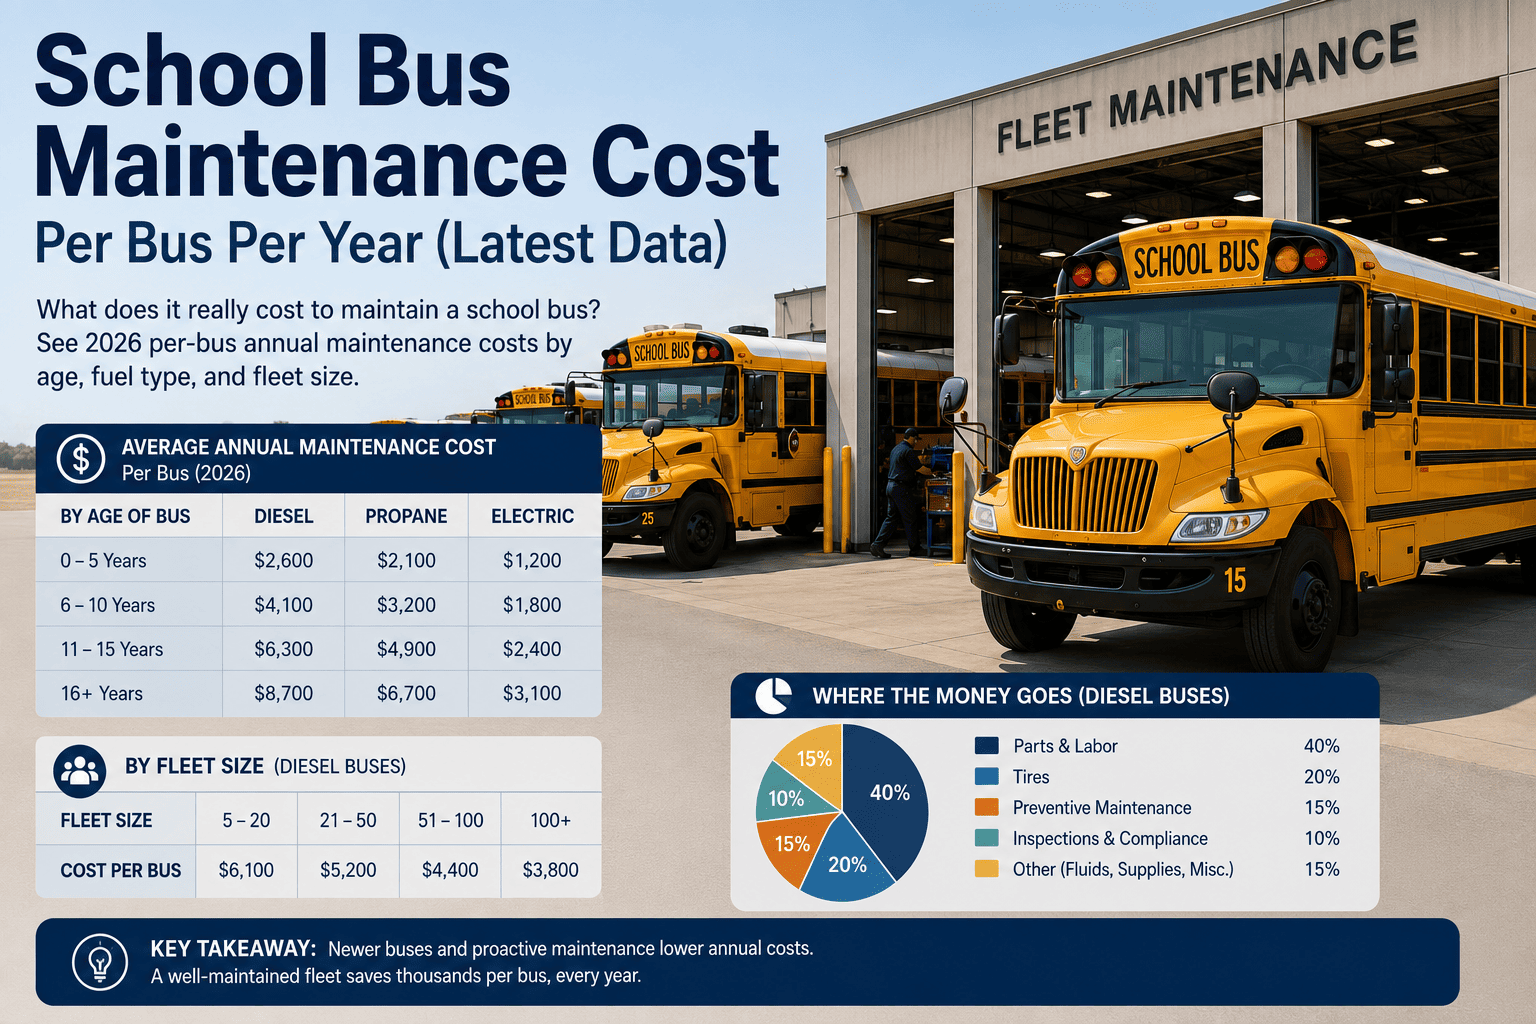
School bus maintenance costs follow a predictable J-curve. Low in early years, flat through mid-life, then steeply rising after year 10-12. A new bus (0-3 years) costs $2,500-$3,500 annually — mostly preventative maintenance (oil changes, filters, inspections). A bus in its prime (4-8 years) costs $3,500-$5,500 annually — preventative maintenance plus minor component replacements (brakes, batteries, belts, hoses). An aging bus (9-12 years) costs $5,500-$8,000 annually — major component replacements begin (alternators, starters, compressors, cooling systems). A bus near retirement (13-15+ years) costs $8,000-$12,000+ annually — multiple major repairs, increased downtime, parts availability challenges. Many districts replace buses at year 12-15 when annual maintenance cost exceeds annual depreciation. The breakeven point varies by region and bus usage. Urban districts with severe duty cycles reach the cost tipping point earlier (year 10-12). Rural districts with highway driving may push to year 15-18 before costs escalate. Track your own fleet's cost curve to determine optimal replacement age.
Fuel choice impacts maintenance costs significantly. Electric buses have the lowest annual maintenance cost because they have fewer moving parts (no oil changes, no transmission, no exhaust system, no fuel system). Maintenance costs for electric buses average $2,200-$3,500 per bus annually — about 40-50% lower than diesel. Diesel buses (majority of fleet) average $4,500-$7,000 per bus annually. Costs vary by age, duty cycle, and regional labor rates. CNG buses average $3,500-$5,500 per bus annually — lower fuel cost but similar maintenance to diesel (spark plugs, high-pressure fuel system components). The maintenance cost advantage of electric buses increases with age. A 10-year-old diesel bus may cost $8,000+ annually. A 10-year-old electric bus costs $3,000-$4,500 annually due to fewer wear components. However, electric bus battery replacement (year 12-15) can add $15,000-$30,000 one-time cost, which changes lifecycle cost calculation. Many districts project electric buses will have lower total cost of ownership despite higher purchase price, driven by maintenance and fuel savings over 12-15 years.
Larger fleets achieve lower per-bus maintenance costs through economies of scale. A small district with 10-25 buses pays $5,500-$8,500 per bus annually. A mid-size district with 50-100 buses pays $4,500-$6,500 per bus annually. A large district with 150-500+ buses pays $4,000-$6,000 per bus annually. Why the difference? Larger fleets can afford specialized mechanics (brake specialist, transmission specialist, electrical specialist), reducing diagnostic time and repair time. Larger fleets can stock parts in bulk, reducing per-unit cost. Larger fleets can invest in CMMS software, improving PM compliance and reducing emergency repairs. Larger fleets can negotiate better labor rates with outside vendors. Smaller fleets can close the gap by using CMMS software (to improve PM compliance and reduce emergency repairs), partnering with neighboring districts for shared mechanics, and joining purchasing cooperatives for parts discounts.
When comparing maintenance costs, ensure you're comparing apples to apples. Some districts include only parts and labor for repairs. Others include shop supplies, outside vendor work, and administrative overhead. Standard maintenance cost definition includes: parts (all replacement components, filters, fluids, belts, hoses, bulbs, wipers), labor (mechanic wages, benefits, overtime for maintenance work), outside repairs (dealer work, specialty shop work, warranty claim administration), shop supplies (cleaning supplies, rags, disposal fees), and administrative overhead (CMMS software, parts inventory management, maintenance supervisor salary allocation). Not typically included: fuel, insurance, depreciation, driver wages, route planning software. Budgeting best practice: track both "maintenance-only" (parts + labor) and "total operating" (including fuel and overhead). Compare your maintenance-only numbers to benchmarks. Compare your total operating numbers to budget projections.
School bus maintenance costs vary by age, fuel type, and fleet size. A new diesel bus costs $3,500-$5,000 annually. That same bus at 12 years costs $7,000-$10,000+ annually. Electric buses have lower annual maintenance ($2,200-$3,500) but higher purchase price and eventual battery replacement cost. Small fleets pay 20-40% more per bus than large fleets due to lack of economies of scale. The districts that control costs don't guess — they track actual maintenance spend per bus, benchmark against industry averages, and use CMMS software to improve PM compliance. Knowing your cost per bus is the first step to reducing it. Track everything. Compare every year. Act on the data.
School bus maintenance cost per bus ranges from $2,500 for a new electric bus to $12,000+ for an aging diesel bus. National averages help you benchmark, but your specific fleet's numbers matter most. Track actual maintenance spend per bus by age and fuel type. Compare to benchmarks annually. Use the data to build budgets, justify replacement decisions, and identify outliers. A bus costing $8,000 annually while fleet average is $5,000 needs investigation. The districts that control costs don't rely on averages — they track their own data, improve PM compliance, and invest in CMMS software to automate maintenance tracking and reduce emergency repairs. Know your numbers. Reduce your costs. Extend your bus life.


