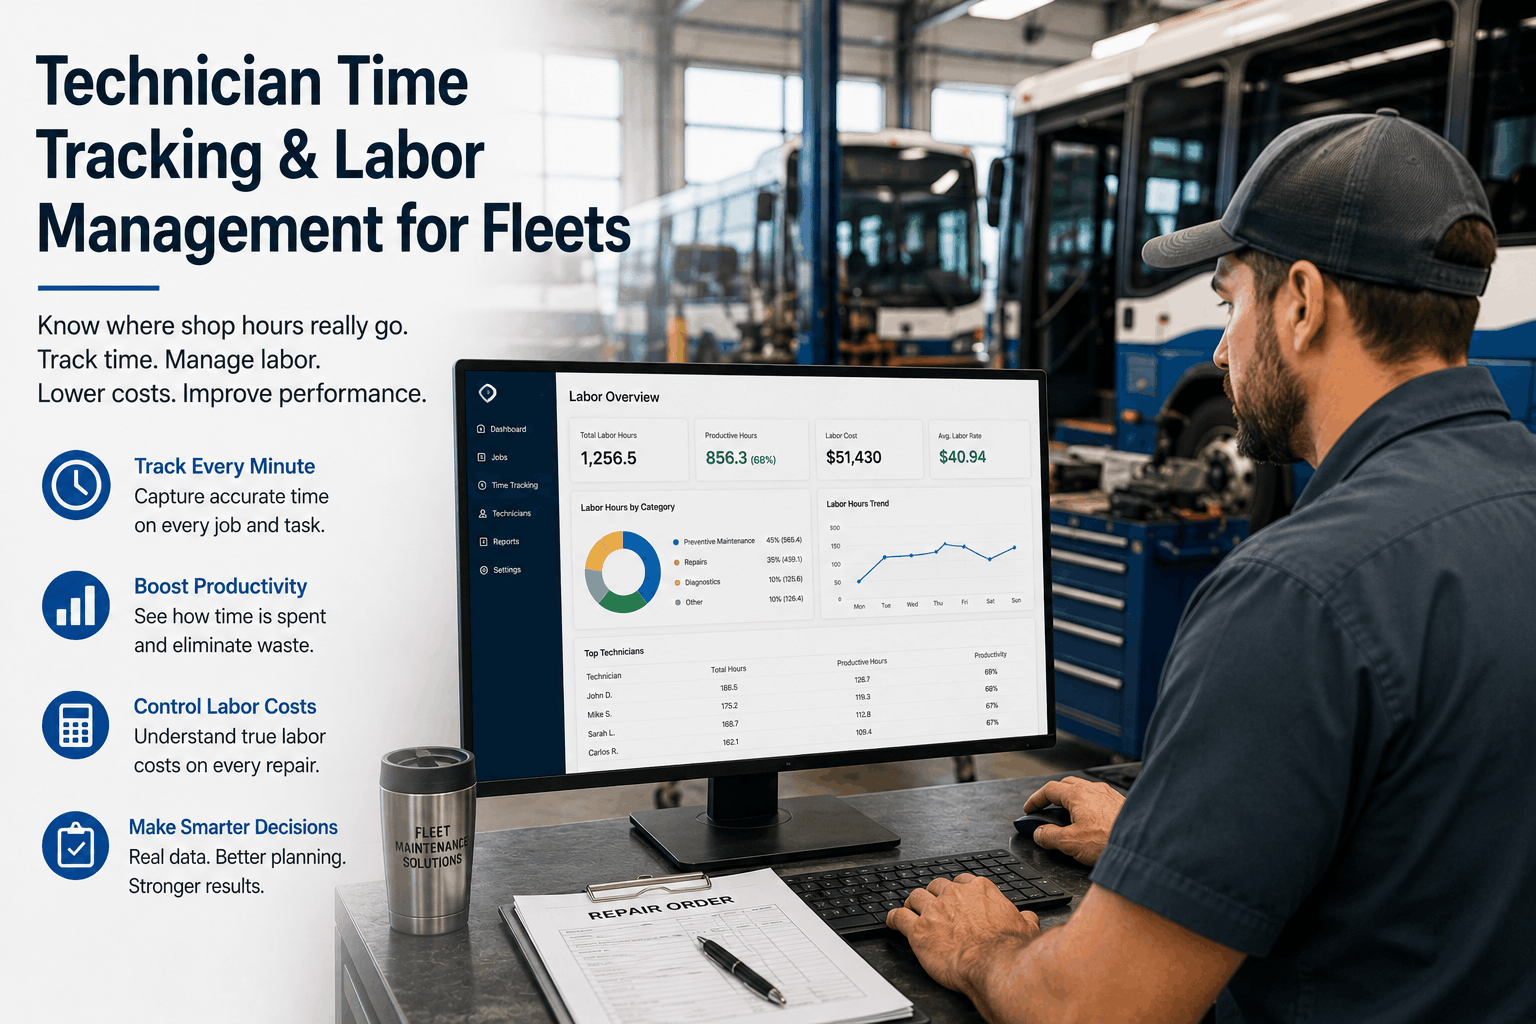
A fleet operator managing a 45-bus fleet had no visibility into how technicians spent their time. A technician punched in at eight, punched out at five. Whether they spent six hours on productive repairs or four hours on admin/cleanup was unknown. Labor costs were opaque: total payroll was clear but the cost per repair was invisible. The fleet didn't know if repairs costing $1,000 in parts were actually costing $500 or $2,000 in labor. Technicians weren't accountable for efficiency—whether they completed two complex repairs or one per day looked identical on the timecard. The solution: implement technician time tracking. Each technician tracks time against specific work orders. When they move from one repair to another, they log the time spent and start a new task. The system automatically calculates: total hours per technician, billable hours (actual repair work), non-billable hours (admin, training, cleanup), average repair time, utilization rate, and cost per repair. Suddenly the data revealed patterns: one technician averaged six hours per repair; another averaged three. The six-hour tech was assigned to complex jobs; the three-hour tech was assigned to routine work. But when both were assigned the same job, the disparity was clear—skill gap or efficiency gap. Training and coaching improved output. A fleet director reports: "Time tracking data showed we were massively underutilizing capacity. Technicians were working 40-hour weeks but only billing 24 hours (16 hours non-billable). By improving scheduling and reducing meetings, we increased billable hours to 32. Same technicians, same hours, 33% more productivity." This guide explains how time tracking systems reveal labor inefficiency and enable data-driven management.
Know where shop hours really go. Learn how time tracking and labor management software reveal productivity gaps, true repair costs, and unlock operational efficiency.
Most fleets have no visibility into labor efficiency. A technician works 40 hours weekly. The timecard shows 40 hours. From management perspective, that's the data. But where did those 40 hours actually go? Without time tracking, the breakdown is opaque. Typical breakdowns (from fleets that implemented tracking and discovered): 24 hours billable to repairs (actual productive work), 6 hours administrative (work orders, email, meetings), 4 hours training/skill development, 3 hours waiting/idle (parts not available, job delayed, waiting for next assignment), 2 hours cleanup, 1 hour other. The 16 non-billable hours aren't "wasted"—some (training, cleanup) are necessary. But 4-5 hours weekly of idle/waiting time is waste that could be eliminated through better scheduling. Multiply across a team: 8 technicians × 5 hours idle weekly = 40 wasted hours per week = 2,080 hours annually = equivalent of one full-time technician lost to inefficiency. If a technician costs $75,000 annually, that's $75,000 of lost productivity per fleet. Without time tracking, you don't see it. A fleet manager explains: "I thought we were efficient. Our technicians were working their 40 hours. Implementing time tracking revealed 50+ hours weekly of idle time across the team. We were effectively operating with one fewer technician than we thought we had. Fixing scheduling cut that idle time in half. We gained the equivalent of half a technician without hiring. That data was worth $40,000+ annually in found productivity." Time tracking reveals not just aggregate idle time but which technicians are most efficient and which are struggling. A technician averaging 3 hours per routine oil-change job performs at 2x the speed of a technician averaging 6 hours. Why? Skill, tools, efficiency, focus, or assignment? Time tracking + outcome data reveals the pattern. You can then coach, train, or reassign based on evidence rather than guessing.
Time tracking enables accurate cost-per-repair calculation. A transmission replacement looks simple: parts cost $12,000, labor cost... unclear. If you don't know how many hours were spent, you don't know if the repair cost $500 or $2,000 in labor. Accurate repair costing requires: (1) Work order creation (task defined), (2) Time tracking (hours logged against the task), (3) Labor rate application (hourly rate × hours = labor cost), (4) Parts cost tracking (parts used recorded), (5) Overhead allocation (facility, tools, management time prorated across repairs). A properly costed repair shows true profitability. Example: transmission replacement, part cost $12,000, labor hours logged: 14 hours, labor cost (at $45/hour loaded rate): $630, overhead allocation: $200. Total repair cost: $12,830. Revenue from customer: $13,500. Profit: $670 (5% margin). But a fleet without tracking doesn't know this. They bid $13,500, feeling like they're breaking even or losing money, because they don't see the actual cost. Or they underbid at $12,500, thinking they're fine, but actually losing $330 per repair. Time tracking data eliminates guessing. You see the real cost. You can then: (1) Price repairs accurately, (2) Identify jobs that are unprofitable (too much labor, parts cost too high), (3) Coach technicians on efficiency (job takes 20 hours, industry standard is 12 hours—investigate why), (4) Make sourcing decisions (if a part consistently requires excessive labor to install, find a better part or supplier). One fleet used time tracking to identify that a particular HVAC system replacement was consistently taking 18 hours (industry standard: 10 hours). Investigation revealed the system design made installation awkward. They switched to a different system (same functionality, different design) that installed in 10 hours. Change saved $360 per repair in labor × 8 repairs annually = $2,880 year. The system cost an extra $200 per unit ($1,600 total), so net savings: $1,280 per year. That data-driven decision was only possible with time tracking showing the labor pattern.
Time tracking creates individual technician visibility. Without it, performance is invisible. You might suspect one technician is slow, but without data, you can't say why or quantify it. With time tracking, patterns emerge: Technician A completes 5.2 repairs daily (average 7.7 hours per repair). Technician B completes 4.1 repairs daily (average 9.8 hours per repair). Why 30% difference? Is B assigned harder jobs? Assigned to complex specialties where longer time is normal? Or is there a skill gap? Time tracking + job complexity classification clarifies. If both are assigned the same mix of job difficulty, time difference is likely skill/efficiency (B needs training) or distraction/engagement (B needs coaching). If B is consistently assigned harder jobs, then longer time is expected and appropriate. Accountability becomes fact-based. A technician can't say "the jobs are just harder for me" because the data either confirms or contradicts it. Conversations shift from subjective ("I work as hard as I can") to objective ("here's your average repair time; the team average is X; let's discuss why and how to improve"). Time tracking can feel invasive to technicians. Transparency matters. A fleet that frames time tracking as "we want to help you be efficient and support you with accurate data" sees different adoption than "we're monitoring whether you're lazy." When technicians understand that time data reveals obstacles (parts delays, tool shortages, unclear instructions) so management can fix them, engagement improves. One technician stated: "At first I thought time tracking was Big Brother. Then I realized my manager used the data to identify that I was spending 90 minutes per job waiting for parts from the parts manager. Management fixed the parts workflow and I gained 7 hours weekly of productive time. Suddenly I felt supported, not monitored." Transparent use of time data builds trust instead of resentment.
Manual time tracking (paper timesheets, spreadsheets) fails at scale. A modern labor management system should include: (1) Mobile time entry (technician opens app, selects work order, logs start/stop time, notes any delays), (2) Automatic calculations (total hours per repair, billable vs. non-billable, cost per job), (3) Utilization dashboards (see real-time status of each technician, workload distribution), (4) Cost per repair reporting (parts + labor + overhead = true repair cost), (5) Productivity analytics (average time per job type, performance trends, outliers), (6) Scheduling integration (system knows who's assigned what, flags when technician is idle, suggests next job). Integration with maintenance management system ensures work orders flow seamlessly. When a repair is completed, time is logged. System automatically calculates cost. Cost is visible to management immediately. Comparisons to estimates show if jobs ran over. Patterns emerge: certain repairs consistently take longer than estimated—why? Maybe the estimate is wrong. Maybe the technician needs training. Maybe parts delays are the cause. The data enables informed decisions. One fleet manager explains: "Before time tracking, I had zero visibility into repair costs. I priced jobs based on guesses and what I thought was market rate. Implementing time tracking revealed I was underpricing complex repairs by 40-50%. Labor costs were way higher than I assumed. I adjusted pricing and profitability improved immediately. The system also showed me which repairs were consistently over-time (machine tool failures required exceptional diagnostics), so I trained a technician to specialize in diagnostics and reduced time by 30%. That specialist skill unlocked profitability I didn't know was possible."
Once time tracking reveals utilization gaps, what's next? Strategies to improve include: (1) Reduce admin overhead (digitize work orders, eliminate unnecessary meetings, create quick-reference systems so techs don't spend 30 minutes looking up procedures), (2) Improve scheduling (don't interrupt technicians mid-job; batch similar repairs; sequence jobs so parts are staged before work begins), (3) Parts management (ensure parts are on hand before job starts; delays are a major idle-time driver), (4) Cross-training (technician waiting for assignment in their specialty can assist another specialty; reduces idle), (5) Predictive maintenance (schedule PM proactively so emergency breakdowns don't disrupt workflow), (6) Performance coaching (if a technician is consistently slow, provide training or retraining). A fleet implemented these improvements: reduced admin time by 3 hours weekly per technician (digitized processes), improved parts availability (90% of parts in stock before job start, down from 60%), implemented cross-training (reduced idle time from 4 hours weekly to 1.5 hours), and provided advanced training for techs assigned to complex jobs. Result: billable utilization increased from 60% to 82% without adding staff or pushing longer hours. Additional capacity: equivalent of 2.6 extra technicians gained through improved efficiency. Cost of improvements: $120,000 annually (training, systems, parts inventory). Value gained: 2.6 technicians × $75,000 = $195,000 in increased capacity. ROI: 163% year one.


