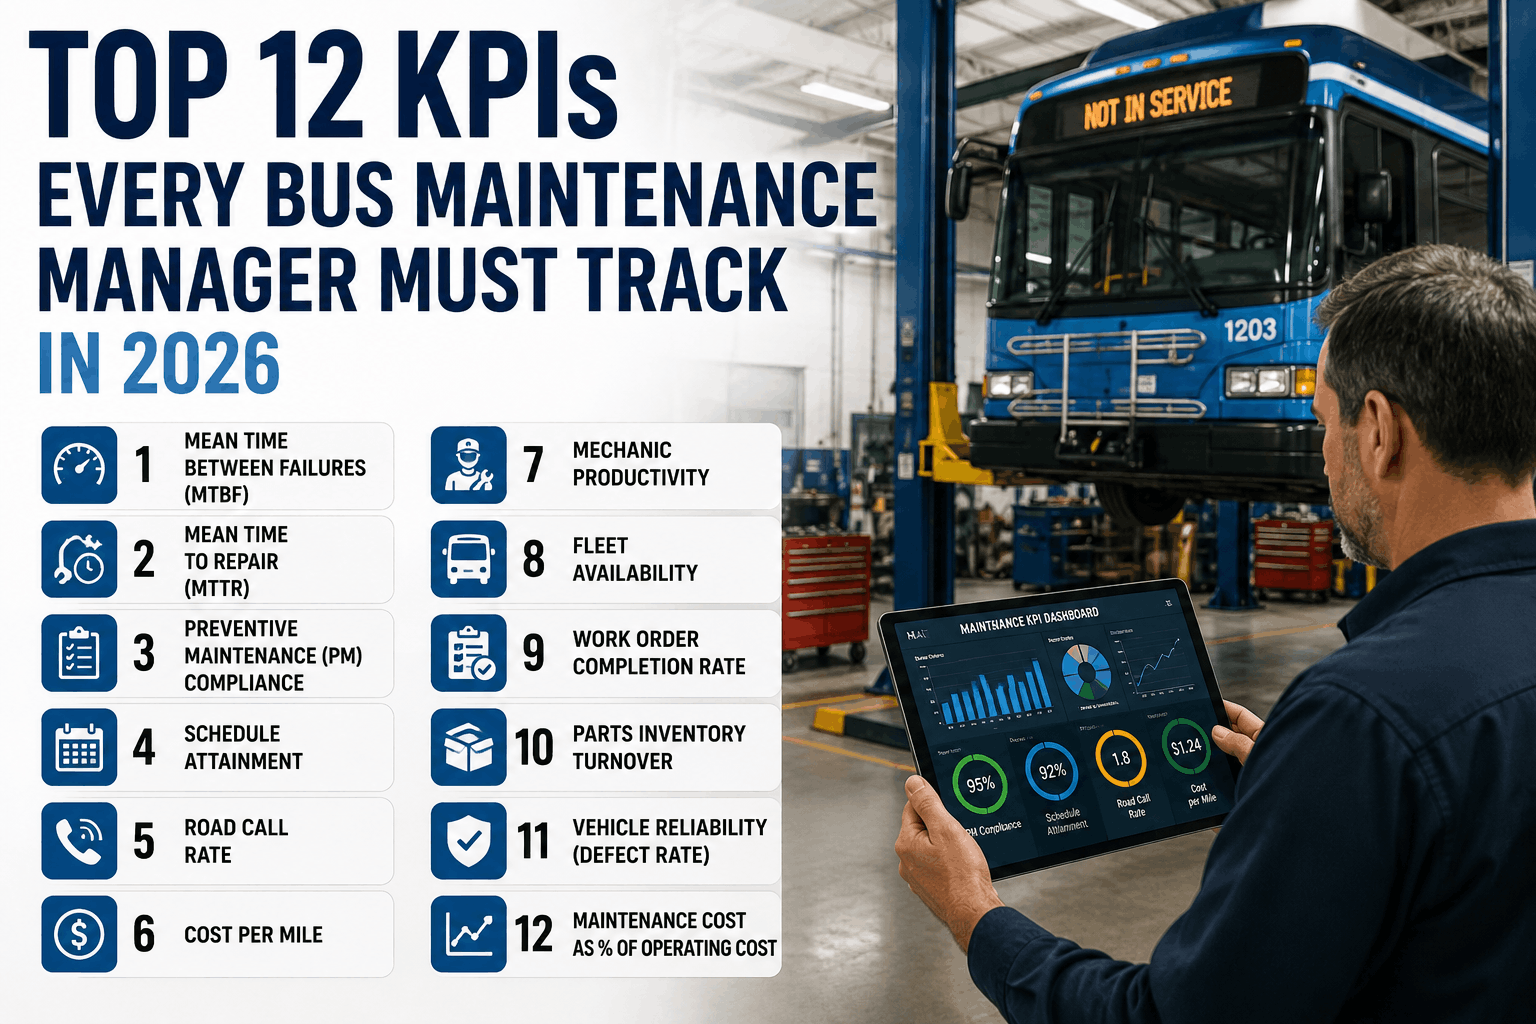
Bus maintenance managers face increasing pressure to maximize uptime, control costs, and ensure fleet safety. Tracking the right key performance indicators transforms maintenance from reactive to proactive, reducing breakdowns by up to 60% and cutting repair costs by over 40%. This guide covers the 12 essential KPIs every bus maintenance manager must track in 2026 to drive fleet performance and budget control.
2026 Bus Maintenance KPI Guide
Top 12 KPIs Every Bus Maintenance Manager Must Track in 2026
The 12 bus maintenance KPIs that drive uptime and budget control in 2026: MTBF, MTTR, PM compliance, schedule attainment, road call rate, cost per mile + more.
Why Maintenance KPIs Matter for Bus Fleets
Fleets using KPI-driven maintenance programs achieve 40% higher PM compliance, 55% fewer road calls, and 32% lower maintenance costs per mile. Without KPIs, maintenance becomes reactive, leading to unpredictable costs and service disruptions.
40%
Higher PM compliance with KPIs
55%
Fewer road calls
32%
Lower maintenance costs per mile
98%
Target fleet availability
Top 12 Bus Maintenance KPIs — Ranked by Impact
Each KPI is ranked based on its impact on fleet uptime, cost control, and operational efficiency. Track these metrics weekly and monthly to drive continuous improvement in your maintenance program.
1
PM Compliance Rate
Percentage of scheduled PM services completed on time. Target: 95%+. Low compliance drives breakdowns, higher costs, and shorter vehicle life.
2
Mean Time Between Failures
Average operating hours between component failures. Target: Increasing trend. Short MTBF indicates PM gaps or component quality issues.
3
Mean Time To Repair
Average time to complete repairs from diagnosis to return to service. Target: Decreasing trend. High MTTR indicates parts delays or technician gaps.
4
Road Call Rate
Breakdowns requiring roadside assistance per 100,000 miles. Target: Under 1.0. Rising rate indicates reliability issues or PM gaps.
5
Cost Per Mile
Total maintenance cost divided by total miles. Target: Industry average $0.45–$0.65 per mile. Spike indicates component failures or inefficient practices.
6
Schedule Attainment
Percentage of planned maintenance completed as scheduled. Target: 90%+. Low attainment means reactive work is overwhelming the shop.
7
Fleet Availability
Percentage of vehicles available for service. Target: 95%+. Low availability indicates maintenance backlog or excessive downtime.
8
Parts Availability
In-stock rate of critical parts. Target: 95%+. Low availability increases MTTR and vehicle downtime.
9
Technician Productivity
Wrench time or billable ratio. Target: 75%+ wrench time. Low productivity indicates inefficient processes or poor shop management.
10
First Pass Yield
Percentage of repairs completed correctly the first time. Target: 95%+. Low FPY means rework, wasted labor, and extended downtime.
11
Component Life
Average life of major components like tires, brakes, batteries. Target: At or above OEM specifications. Short life indicates PM gaps or poor quality.
12
Safety Incident Rate
Maintenance-related safety incidents per 1,000 technician hours. Target: Near zero. Rising rate indicates training or procedural gaps.
KPI Performance Trends — Year Over Year
PM compliance shows steady improvement from 72% to 95% over five years. MTBF follows a similar upward trend as proactive maintenance reduces component failures. Organizations tracking these KPIs consistently outperform industry averages in reliability and cost control.
KPI Impact Distribution
Reliability-focused KPIs like MTBF and road call rate account for 35% of overall fleet performance impact. PM effectiveness and efficiency metrics contribute 28% and 22% respectively. Cost control KPIs provide 15% impact but are essential for budget management.
KPI Performance — Pass / Fail Thresholds
PM Compliance
Pass: 95%+ completion on time. Consistent weekly performance. No overdue PMs.
Fail: Below 85%. PMs overdue. Reactive maintenance dominates.
MTBF
Pass: Increasing trend. Above industry average for bus type. Stable component life.
Fail: Decreasing trend. Frequent failures. Below industry average.
MTTR
Pass: Decreasing trend. Parts availability above 95%. Skilled technicians.
Fail: Increasing trend. Parts delays. Inefficient repair processes.
Road Call Rate
Pass: Under 1.0 per 100,000 miles. Decreasing trend. PM effectiveness visible.
Fail: Above 2.0 per 100,000 miles. Increasing trend. PM or quality issues.
Cost Per Mile
Pass: Under $0.55. Stable or decreasing. Cost control effective.
Fail: Above $0.75. Increasing trend. Inefficient operations.
Fleet Availability
Pass: 95%+ vehicles available. Consistent week over week. PM scheduling optimized.
Fail: Below 90%. Extended downtime. Backlog or staffing gaps.
Maintenance KPI Dashboard — Core Metrics
Track these five essential metrics weekly to maintain visibility into your maintenance program health:
PM Compliance
Target: 95%+. Track weekly. Missed PMs create cascading failures and higher costs.
Fleet Availability
Target: 95%+. Track daily. Low availability means service disruption and lost revenue.
Road Call Rate
Target: Under 1.0 per 100K miles. Track monthly. Rising rate indicates PM or quality issues.
MTBF Trend
Target: Increasing. Track monthly. Short MTBF points to component or PM gaps.
Cost Per Mile
Target: Stable or decreasing. Track monthly. Spike indicates major component failures or inefficiency.
Our transit agency implemented a comprehensive KPI dashboard tracking all 12 metrics. In 18 months, PM compliance improved from 78% to 97%, road call rate dropped by 58%, and maintenance cost per mile decreased from $0.68 to $0.51. The dashboard helps us identify issues before they become failures and justify maintenance investments to leadership.
Track Your Maintenance KPIs with BusCMMS
BusCMMS provides real-time dashboards for all 12 maintenance KPIs. Auto-calculate PM compliance, MTBF, MTTR, road call rates, cost per mile, and more. Identify trends, spot issues early, and justify maintenance decisions with data. Start your free trial today.
Bus Maintenance KPI FAQs
What is PM compliance and why does it matter?
PM compliance measures the percentage of scheduled preventive maintenance services completed on time. It's the most important leading indicator for fleet reliability. High PM compliance (95%+) correlates with 50% fewer breakdowns and 30% lower maintenance costs.
How do you calculate MTBF for buses?
MTBF is calculated as total operating hours divided by the number of failures in that period. For example, a fleet of 100 buses operating 8,000 hours with 80 failures has an MTBF of 100 hours. Track MTBF by component type to identify reliability issues.
What is a good road call rate for bus fleets?
A good road call rate is under 1.0 per 100,000 miles. High-performing fleets achieve under 0.5 per 100,000 miles. Road call rate above 2.0 indicates significant PM gaps or component quality issues requiring immediate attention.
What is the industry average cost per mile for bus maintenance?
Industry average maintenance cost per mile ranges from $0.45 to $0.65 depending on bus type, age, and service conditions. Transit buses average $0.55–$0.65 per mile. School buses average $0.45–$0.55 per mile. Track your trend to identify cost drivers.
How often should I review maintenance KPIs?
Review leading indicators like PM compliance weekly. Review lagging indicators like road call rate, MTBF, and cost per mile monthly. Review long-term trends quarterly to adjust maintenance strategy and budget planning.
Can BusCMMS automate KPI tracking?
Yes. BusCMMS automatically calculates all 12 KPIs from your maintenance data. The system generates real-time dashboards, trend charts, and alert notifications when KPIs fall below thresholds. No manual data entry required.
The Bottom Line
Tracking the right maintenance KPIs transforms fleet management from reactive to proactive. The 12 essential KPIs — PM compliance, MTBF, MTTR, road call rate, cost per mile, schedule attainment, fleet availability, parts availability, technician productivity, first pass yield, component life, and safety incident rate — provide complete visibility into your maintenance program health. PM compliance leads the list as the most impactful leading indicator. Set targets based on industry benchmarks: 95%+ PM compliance, MTBF increasing trend, road call rate under 1.0, and cost per mile under $0.65. Review KPIs weekly for leading indicators and monthly for lagging metrics. Combine these KPIs with BusCMMS for automated tracking, real-time dashboards, and proactive alerts that help you identify issues before they cause failures. Start your free trial today and see the difference data-driven maintenance makes in your fleet.


