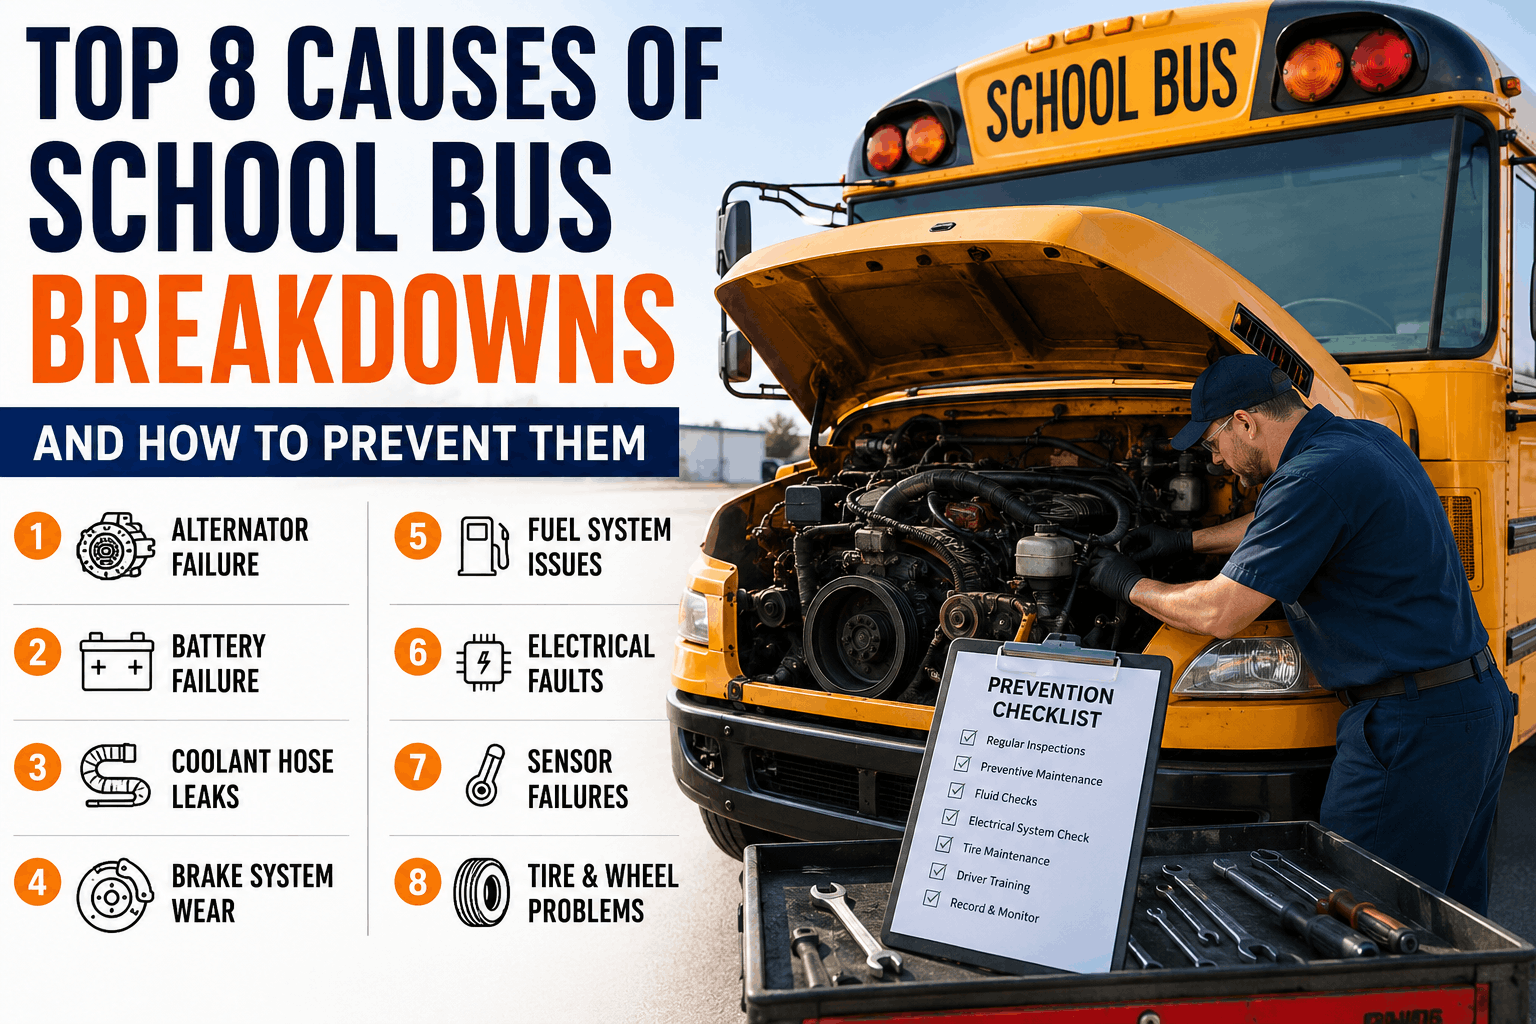
School bus breakdowns disrupt student transportation, cause delays, and lead to costly repairs. Understanding the most common failure modes helps fleet managers implement preventive measures that reduce downtime and improve safety. This analysis ranks the top 8 causes of school bus breakdowns by frequency, with prevention checklists and repair cost data to keep your fleet running reliably.
2026 School Bus Breakdown Analysis
Top 8 Causes of School Bus Breakdowns and How to Prevent Them
8 most common school bus breakdown causes ranked by frequency: alternator, batteries, hoses, brakes, fuel, sensors. Prevention checklist + repair cost data.
School Bus Breakdown Statistics
School buses log over 3 billion miles annually in the US. Breakdowns affect nearly 10% of fleets each month, with average repair costs exceeding $1,200 per incident. Implementing preventive maintenance can reduce breakdown frequency by up to 60%.
3B+
Annual school bus miles
10%
Fleets with monthly breakdowns
$1,200
Average breakdown repair cost
60%
Breakdown reduction with PM
Top 8 Causes of School Bus Breakdowns — Ranked by Frequency
Each cause is ranked based on fleet maintenance data from school districts across the US. Prevention strategies and typical repair costs are included for each failure mode.
1
Alternator Failure
22% of breakdowns. Causes: worn brushes, failed diode, belt slippage. Prevention: test alternator output every PM. Repair cost: $400–$800.
2
Battery Failure
18% of breakdowns. Corrosion, low electrolyte, loose connections. Prevention: clean terminals, load test every 6 months. Repair cost: $200–$500.
3
Coolant Hose Leaks
15% of breakdowns. Cracks, bulges, loose clamps. Prevention: visual inspection, pressure test annually. Repair cost: $150–$400.
4
Brake System Failure
12% of breakdowns. Worn pads, air leaks, low fluid. Prevention: inspect pads and air system monthly. Repair cost: $500–$1,200.
5
Fuel System Issues
10% of breakdowns. Clogged filters, fuel pump failure, contaminated fuel. Prevention: change filters per schedule. Repair cost: $300–$900.
6
Sensor & Electrical Faults
8% of breakdowns. ABS, engine, or transmission sensors. Prevention: scan fault codes during PM. Repair cost: $250–$700.
7
Starter Motor Failure
7% of breakdowns. Worn solenoid, damaged gears. Prevention: listen for unusual sounds, test draw. Repair cost: $350–$800.
8
Tire & Wheel Issues
6% of breakdowns. Low pressure, tread separation, wheel bearing failure. Prevention: check pressure and tread weekly. Repair cost: $200–$600.
Breakdown Frequency Trends Over the School Year
Breakdowns per 100 buses show a clear seasonal pattern. Winter months see a 40% increase due to battery and alternator strain from cold starts. Early fall breakdowns often result from deferred summer maintenance. Regular PM flattens these peaks significantly.
Breakdown Cause Distribution
Electrical system failures (alternator and battery) represent 40% of all breakdowns. Cooling system hoses and brake issues follow. The remaining 45% includes fuel, sensors, starter, tires, and miscellaneous causes. Focusing PM on the top three can eliminate more than half of all roadside failures.
Prevention Criteria — Pass / Fail Thresholds
Alternator Test
Pass: Output voltage 13.8–14.4V at idle. No belt slippage. Brushes within spec.
Fail: Voltage below 12.8V. Noisy bearings. Belt glazed or loose.
Battery Health
Pass: Load test indicates 80%+ capacity. Terminals clean and tight. Electrolyte at proper level.
Fail: Load test below 60% capacity. Corrosion present. Low electrolyte.
Coolant Hoses
Pass: No cracks, bulges, or soft spots. Clamps secure. Coolant at proper level.
Fail: Visible cracks or bulges. Leaking at connections. Coolant low or contaminated.
Brake System
Pass: Pad thickness above minimum. Air pressure holds steady. No leaks.
Fail: Pads below minimum. Air pressure drops. Brake fluid contamination.
Fuel System
Pass: Filter changed on schedule. No leaks. Fuel pressure within spec.
Fail: Filter overdue. Leaks at connections. Poor fuel pressure.
Sensor Diagnostics
Pass: No active fault codes. Sensor readings within normal range.
Fail: Active fault codes. Erratic sensor data. ABS or engine warning lights.
Fleet Reliability KPIs
Track these five key performance indicators to measure your breakdown prevention program:
Breakdown Rate
Target: Under 2 per 100 buses per month. Track monthly. Rising rate indicates maintenance gaps.
Mean Time Between Failures
Target: Increasing trend. Track quarterly. Short MTBF suggests component quality or PM issues.
Repair Cost per Breakdown
Target: Below $1,000 average. Track monthly. Spike indicates major component failures.
PM Completion Rate
Target: 95%+ on-time. Track weekly. Missed PMs correlate with higher breakdown rates.
Roadside Assistance Calls
Target: Decreasing trend. Track monthly. High calls indicate reliability issues or severe weather impacts.
Our district implemented a proactive maintenance program focusing on the top breakdown causes. We reduced roadside breakdowns from 4.2 per 100 buses to 1.1 per 100 buses in 12 months. Alternator failures dropped by 65% after we added voltage testing to every PM. Total repair costs decreased by 42%, and we saved over $250,000 in a single year.
Prevent Breakdowns with Proactive Maintenance
BusCMMS automates PM scheduling, tracks component life, and alerts you to potential failures before they strand buses. Digital inspection forms guide technicians through alternator, battery, and hose checks. Reduce breakdowns by 40% or more. Start your free trial today.
School Bus Breakdown FAQs
What is the most common cause of school bus breakdowns?
Alternator failure is the most common cause, accounting for 22% of all school bus breakdowns. Battery failure follows at 18%, and coolant hose leaks at 15%. Electrical system issues dominate the top three causes.
How can I prevent alternator failure on school buses?
Test alternator output voltage during every PM service. Replace brushes and belts at manufacturer-recommended intervals. Keep battery connections clean to reduce load on the alternator. Early detection prevents roadside failures.
What is the average cost of a school bus breakdown?
Average repair cost is approximately $1,200, but this does not include lost route time, towing, or substitute bus costs. Total downtime can cost an additional $500–$1,000 per incident. Preventive maintenance is far more cost-effective.
How often should I inspect school bus hoses and belts?
Inspect hoses and belts at every PM service, typically every 5,000 miles or 3 months. Replace hoses that show cracks, bulges, or soft spots. Serpentine belts should be replaced every 60,000 miles or as recommended.
Does cold weather cause more school bus breakdowns?
Yes. Winter months see a 40% increase in breakdowns due to battery and alternator strain. Cold starts draw more current, and older batteries fail in low temperatures. Preventive checks before winter reduce seasonal spikes.
Can BusCMMS help reduce school bus breakdowns?
Yes. BusCMMS tracks PM schedules, sends alerts for component replacements, and stores inspection history for every bus. The system helps you catch issues like low battery voltage or worn hoses before they cause breakdowns.
The Bottom Line
School bus breakdowns are costly and disruptive, but most are preventable. The top 8 causes — alternator, batteries, hoses, brakes, fuel, sensors, starter, and tires — represent over 90% of all roadside failures. Alternator and battery issues alone account for 40% of breakdowns. By implementing a disciplined preventive maintenance program that includes voltage testing, hose inspection, and brake checks, fleets can reduce breakdown frequency by 60% and cut repair costs by over 40%. Use the pass/fail criteria in this guide to evaluate your current inspection process. Combine these practices with BusCMMS to automate PM scheduling, track component life, and build a complete maintenance history for every bus. Start your free trial today and see the difference proactive maintenance makes in your fleet reliability.


