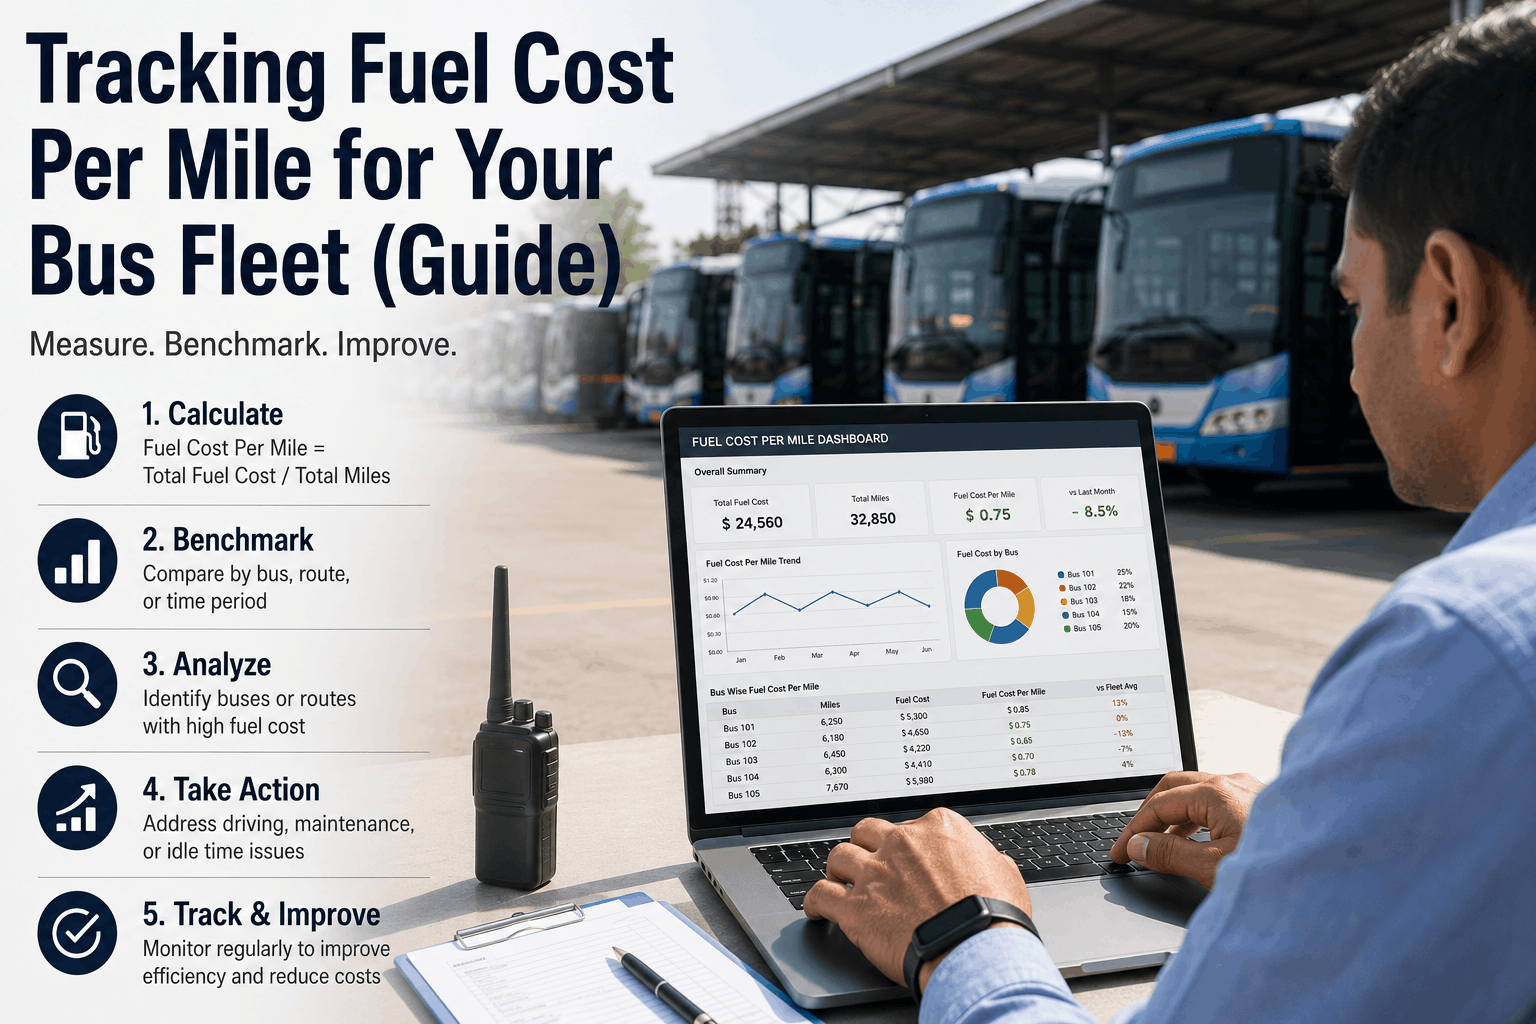
A 150-bus transit fleet in Florida tracked total fuel spend but not cost per mile. The finance director knew the fleet spent $1.8 million annually on diesel. But when asked which buses were the most expensive to fuel, he couldn't answer. Bus 217 was getting 5.8 MPG — best in fleet. Bus 309 was getting 3.2 MPG — worst in fleet. Both ran identical routes. The 3.2 MPG bus cost $0.45 more per mile to operate. Over 40,000 annual miles, that's $18,000 extra fuel cost for one bus. The fleet had six buses under 3.5 MPG — $100,000+ in annual waste they couldn't see because they measured total spend, not cost per mile. This guide covers how to calculate fuel cost per mile, benchmark across your fleet, and use the metric to find waste.
Tracking Fuel Cost Per Mile for Your Bus Fleet (Guide)
Calculate accurately. Benchmark across buses. Flag underperformers. Reduce fuel spend 8-15% with one metric.
Fuel Cost Per Mile — Fleet Benchmark
A 10-cent difference in cost per mile across a 100-bus fleet is $300,000 annually. Track the metric. Find the waste.
How to Calculate Fuel Cost Per Mile
The formula is simple but requires accurate data: Fuel Cost Per Mile = Total Fuel Cost ÷ Total Miles Driven over the same period. For a single bus, over a month: sum all fuel purchases (gallons × price per gallon) and sum all miles driven (odometer end minus odometer start). For example: Bus 401 consumes 250 gallons at $4.00/gal = $1,000 in fuel. It drives 1,500 miles. Fuel cost per mile = $1,000 ÷ 1,500 = $0.667 per mile. For a fleet, calculate per bus, then average. The formula works for any time period: weekly, monthly, annually. Track both short-term (weekly) to catch sudden changes, and long-term (quarterly, annual) to measure trends. The most common error is using estimated miles or fuel — always use actual odometer readings and actual fuel card transaction data.
Fuel Cost Per Mile — Calculation Examples ($4.00/gal diesel)
Calculate cost per mile per bus weekly. Compare to fleet average. Flag buses >10% above average.
"We started tracking cost per mile per bus six months ago. The fleet average was $0.71. Bus 187 was $0.93 — 30% higher. Investigation found a stuck brake caliper on that bus for three months. The driver reported 'sluggish acceleration' but no one connected it to fuel cost. The repair cost $400. Monthly fuel savings: $300. Payback: 6 weeks. We found four other buses with similar issues. Total annual savings from tracking cost per mile: $47,000."
Data You Need: Fuel Transactions + Odometer Readings
Accurate cost per mile requires two data sources: fuel card transactions (date, gallons, price per gallon, total cost, driver/vehicle ID) and odometer readings (starting odometer, ending odometer for the period). Fuel card data should be imported automatically from your fuel card provider. Odometer readings must be captured at every fill-up. The best practice: require odometer entry at the pump before the transaction authorizes. If drivers skip odometer entry, cost per mile cannot be calculated for that fill. The second best practice: telematics integration that auto-populates odometer from GPS at time of fueling. Without accurate odometer readings, cost per mile is guesswork. For fleets without telematics, train drivers to enter odometer every fill. Audit missing odometer entries weekly.
Data Requirements for Cost Per Mile
Missing odometer readings are the #1 reason fleets cannot calculate cost per mile. Make odometer entry mandatory at pump.
A driver who refuses to enter odometer readings is hiding something. Every missing odometer entry means you cannot calculate MPG or cost per mile for that fill. Require it. Enforce it.
Auto-import fuel data and capture odometer readings — sign up free
Benchmarking: What Is a Good Cost Per Mile?
Benchmarks vary by bus type, route, and region. School bus (mixed routes, 5-7 MPG) at $4.00/gal: $0.57-0.80 per mile. Transit bus (urban stop-and-go, 3.5-5 MPG): $0.80-1.14 per mile. Charter/coach (highway, 6-8.5 MPG): $0.47-0.67 per mile. These are fuel-only costs. Do not compare school bus cost per mile to transit bus — different duty cycles produce different MPG. Compare within your fleet: similar buses on similar routes. The fleet average is your benchmark. Any bus more than 10% above fleet average requires investigation. Any bus more than 20% above fleet average requires immediate repair. Track cost per mile by season — winter diesel has lower energy content, expect 3-5% higher cost per mile.
Cost Per Mile Benchmarks by Bus Type ($4.00/gal diesel)
Compare within your fleet — similar buses on similar routes.
Benchmark your fleet against industry averages — book a demo
What Causes High Cost Per Mile?
When a bus shows cost per mile significantly above fleet average, investigate these root causes. Mechanical issues: underinflated tires (5-10% increase), dragging brakes (10-25% increase), bad injectors (5-15% increase), clogged air filter (2-5% increase), worn wheel bearings (2-5% increase). Driver behavior: excessive idling (5-15% increase), aggressive acceleration (10-20% increase), speeding over 60 mph (each 5 mph over reduces MPG 5-7%). Route issues: added stops, new traffic patterns, detours. Fuel price variation: fueling at expensive stations (price per gallon varies $0.50-1.00 between stations). Data error: incorrect odometer entry, vehicle misassignment. The investigation process: check tire pressure and brake drag first (free, quick). Review driver idle reports. Check fuel station prices. Verify odometer entries.
Top Causes of High Cost Per Mile
Underinflated tires — 5-10% increase
Dragging brakes — 10-25% increase
Bad injectors — 5-15% increase
Excessive idling — 5-15% increase
Aggressive driving — 10-20% increase
Fueling at expensive stations — varies
Data errors — common and fixable
Investigate any bus >10% above fleet average. Most causes are fixable within 1-2 hours of shop time.
Flag high-cost buses and investigate automatically — sign up free
Cost Per Mile by Fuel Type: Diesel vs Electric vs CNG
Cost per mile varies dramatically by fuel type. Compare only within fuel type. Diesel baseline: $0.60-0.80 per mile for school buses. CNG: $0.50-0.75 per mile depending on gas prices (typically 10-20% lower than diesel in gas-producing states, similar elsewhere). Electric: $0.22-0.35 per mile for energy only (off-peak charging, no demand charges). Electric with demand charges: $0.40-0.55 per mile. When comparing fuel types for purchasing decisions, use cost per mile, not total fuel spend. A bus with lower cost per mile but higher vehicle price may still be the right choice over 12 years. For existing fleets mixing fuel types, track cost per mile separately for each type. Do not compare diesel cost per mile to electric directly without adjusting for vehicle price and infrastructure.
Cost Per Mile by Fuel Type — School Bus Example
Using Cost Per Mile to Drive Improvement
Cost per mile is useless as a metric if you don't act on it. Build a weekly review process. Step 1: Calculate cost per mile per bus for the past week (or month). Step 2: Compare to fleet average and to each bus's historical average. Step 3: Flag buses with cost per mile >10% above average. Step 4: Investigate root cause — tire pressure, brakes, driver idle reports, fuel station, odometer data quality. Step 5: Assign repair or coaching. Step 6: Track after-repair cost per mile to verify improvement. Share cost per mile reports with drivers. Drivers who see their cost per mile compared to peers change behavior. Reward drivers with consistently low cost per mile. The fleets that use cost per mile as an active management tool reduce fuel spend 8-15% annually.
Cost Per Mile Action Workflow
Share reports with drivers. Reward efficiency. Act on outliers immediately.
"We started publishing a weekly 'Fuel Efficiency Leaderboard' showing cost per mile per driver (anonymized). The worst performer was highlighted in red. Within three weeks, the worst driver improved from $0.82 per mile to $0.71 — a 13% improvement. No coaching. No training. Just visibility. The power of showing drivers their metric cannot be overstated."
Fleet Expert Review
Fuel cost per mile is the single most important fuel metric for bus fleets. Total fuel spend tells you how much you paid. Cost per mile tells you how efficiently you're operating. Two fleets can spend the same on fuel — one might be running efficiently with high miles, the other wasting fuel with low miles. Cost per mile reveals the truth. The fleets that reduce fuel spend don't guess. They measure cost per mile per bus weekly. They flag outliers. They investigate root causes. They fix mechanical issues. They coach drivers. They share results. And they save $50,000-500,000 annually. Fuel cost per mile is not complicated. It's just math. But the fleets that do the math win.
The Bottom Line
Fuel cost per mile is not an accounting metric — it's an operational diagnostic. A bus at $0.80 per mile when the fleet average is $0.65 has a problem. That problem costs $0.15 per mile. On a bus that drives 30,000 miles annually, that's $4,500 in waste — from one bus. Over a 100-bus fleet, hidden waste at that level is $450,000 annually. The solution is measurement. Track cost per mile per bus weekly using fuel card data and odometer readings. Benchmark against fleet average. Flag outliers over 10% above average. Investigate root causes. Fix mechanical issues. Coach drivers. Repeat. BusCMMS automates the entire process — fuel data import, odometer capture, cost per mile calculation, outlier flagging, and reporting. Every bus. Every week. Every dollar accounted for.
Every Bus. Every Fill. Every Dollar.
Fuel cost per mile per bus. Automatic calculation. Outlier flagging. Root cause tracking. Reduce fuel waste 8-15%. Free 14-day trial.
Frequently Asked Questions
How do I calculate fuel cost per mile for a school bus?
What is a good fuel cost per mile for a school bus?
What causes high fuel cost per mile?
How often should I calculate fuel cost per mile?
Can BusCMMS calculate fuel cost per mile automatically?
What's the difference between MPG and fuel cost per mile?
Diesel + CNG + Electric + Hybrid. All Metrics. One Dashboard.
Cost per mile per bus. MPG tracking. Idle monitoring. Maintenance cost per mile. All fuel types. All in one system. Free 14-day trial.


