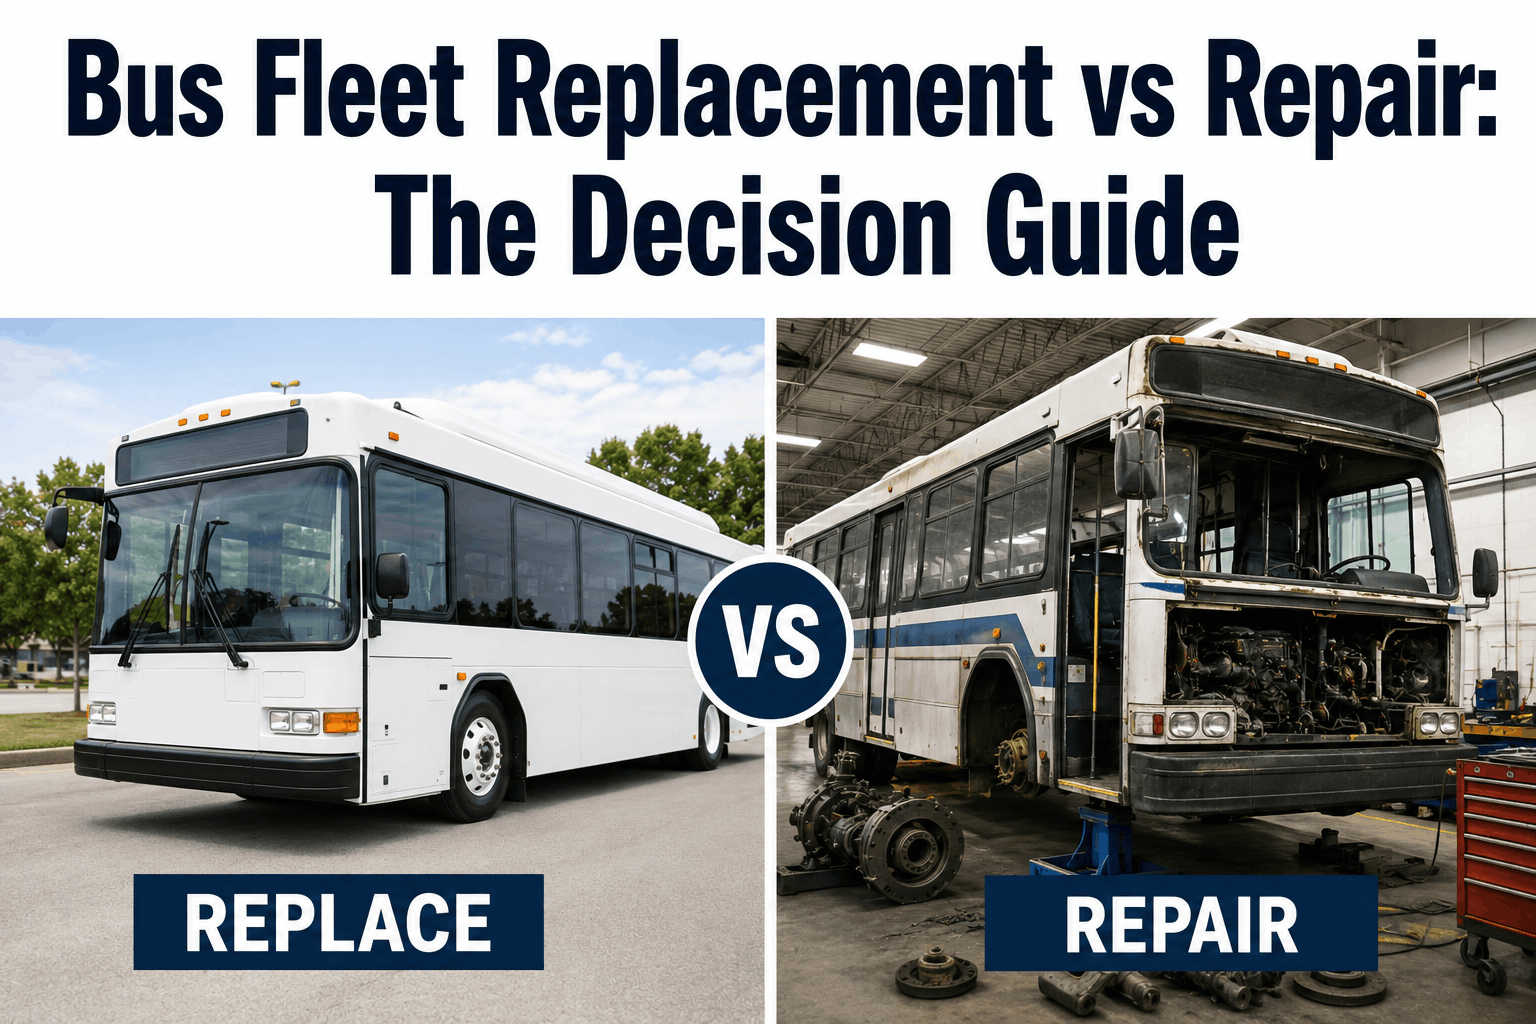
A bus needs a $15,000 transmission repair. The bus is 13 years old with 550,000 miles. Should you repair it for $15K or replace it with a new bus for $350K? The answer depends on the bus's age curve, remaining useful life, maintenance history, and total cost-of-ownership projection. This is the most critical financial decision in fleet management. A wrong call either wastes capital ($15K more repairs on a bus about to die) or makes an expensive replacement ($350K purchase) when a few repairs would have bought another 2–3 years. This guide explains the replace-vs-repair decision matrix, age curves, cost triggers, and how to make data-driven replacement decisions.
Fleet Economics
Bus Fleet Replacement vs Repair: The Decision Guide
When does repair stop making sense? Learn the replace-vs-repair math, age curves, and cost triggers that signal it's time to retire a bus.
The Age Curve: When Repair Costs Accelerate
Bus repair costs follow a predictable age curve. Years 0–5: minimal repairs, predictable maintenance. Years 6–10: moderate repairs, occasional major component service. Years 11–14: repair costs climb sharply. Year 15+: repairs spike to 30–50% of acquisition cost annually. A bus that cost $300,000 might cost $90,000–$150,000 per year to keep on the road in years 15+.
Years 0–5 (New)
Annual Repair Cost: 2–4% of acquisition cost
Status: Reliable, predictable, warranted components
Years 6–10 (Mid-Life)
Annual Repair Cost: 5–10% of acquisition cost
Status: Increasing repairs, major PM needed, consider overhaul
Years 11–14 (Aging)
Annual Repair Cost: 15–25% of acquisition cost
Status: Major repairs frequent, overhaul or replacement consideration
Years 15+ (End-of-Life)
Annual Repair Cost: 30–50% of acquisition cost
Status: Constant breakdown risk, replacement urgency high
Replace vs. Repair Decision Matrix
Bus Age: 8 years, Mileage: 300K, Repair: $12,000 transmission
REPAIR (Clear choice)
Bus is mid-life, repair is manageable cost. Repaired bus should run reliably another 4–6 years (200K+ miles). ROI: $12K now vs $350K replacement in 5 years. Repair wins decisively.
Bus Age: 14 years, Mileage: 650K, Repair: $15,000 (and had $40K repairs last 18 months)
REPLACE (Clear choice)
Bus is aging, repair costs climbing. Additional $15K repair extends life maybe 1–2 years (60K–120K miles). By year 16, another major failure likely. Total cost: $15K + downtime + likely next major repair = $30K–$50K to extend 1–2 years. Replace now, get 12–15 year useful life from new bus.
Bus Age: 11 years, Mileage: 500K, Repair: $20,000 engine, but bus still reliable overall
REPAIR or MID-LIFE OVERHAUL (Decision point)
Bus is at inflection point. Single major repair ($20K) doesn't make sense alone. But bundling with overhaul ($80K–$120K total) extends life 5–10 years. Compare: $120K overhaul = $12K/year for 10 years of life. $350K replacement = $24K/year for 15 years. Overhaul wins economically if bus structure is still sound. Inspect for frame rust, structural damage before deciding.
Cost Triggers That Signal Replacement
Single Repair Exceeds 10% of Replacement Cost
Example: Engine rebuild $35,000 on $350K bus (10% trigger)
Calculate remaining useful life (RUL). If RUL <3 years, replacement ROI better. If RUL >5 years, repair wins.
Annual Repair Cost Exceeds 20% of Replacement Cost
Example: Bus costs $70,000/year in repairs on $350K replacement value
Red flag. Bus approaching end-of-life. Budget for replacement within 18–24 months.
Cumulative Repairs Last 24 Months Exceed 25% of Replacement Cost
Example: $80,000 in repairs over 24 months on $350K bus
Pattern of breakdown. Replacement imminent. Every additional repair just delays inevitable retirement.
Safety-Critical System Failure (Brakes, Steering)
Major brake system failure, steering failure, frame structural damage
Don't repair. Retire immediately. Safety risk outweighs any economic calculation.
We kept an aging bus on the road with constant repairs: $8K here, $15K there. Over 3 years, $60K in repairs. Then transmission failed ($25K repair). Bus was 16 years old, cost us more per year to operate than new bus leasing would have. Should have retired it at year 13 when we had first major repair. Instead, we extended pain and cost by trying to squeeze out more life. Now we use the 20% annual repair cost rule: if bus hits 20% of replacement cost annually, we retire. Clear decision rule prevents emotional attachment to aging buses.
Fleet Manager, 40-bus transit system, Ohio
Make Smart Replacement Decisions
Use the age curve and cost triggers. Avoid expensive repairs on buses nearing end-of-life. Optimize fleet economics.