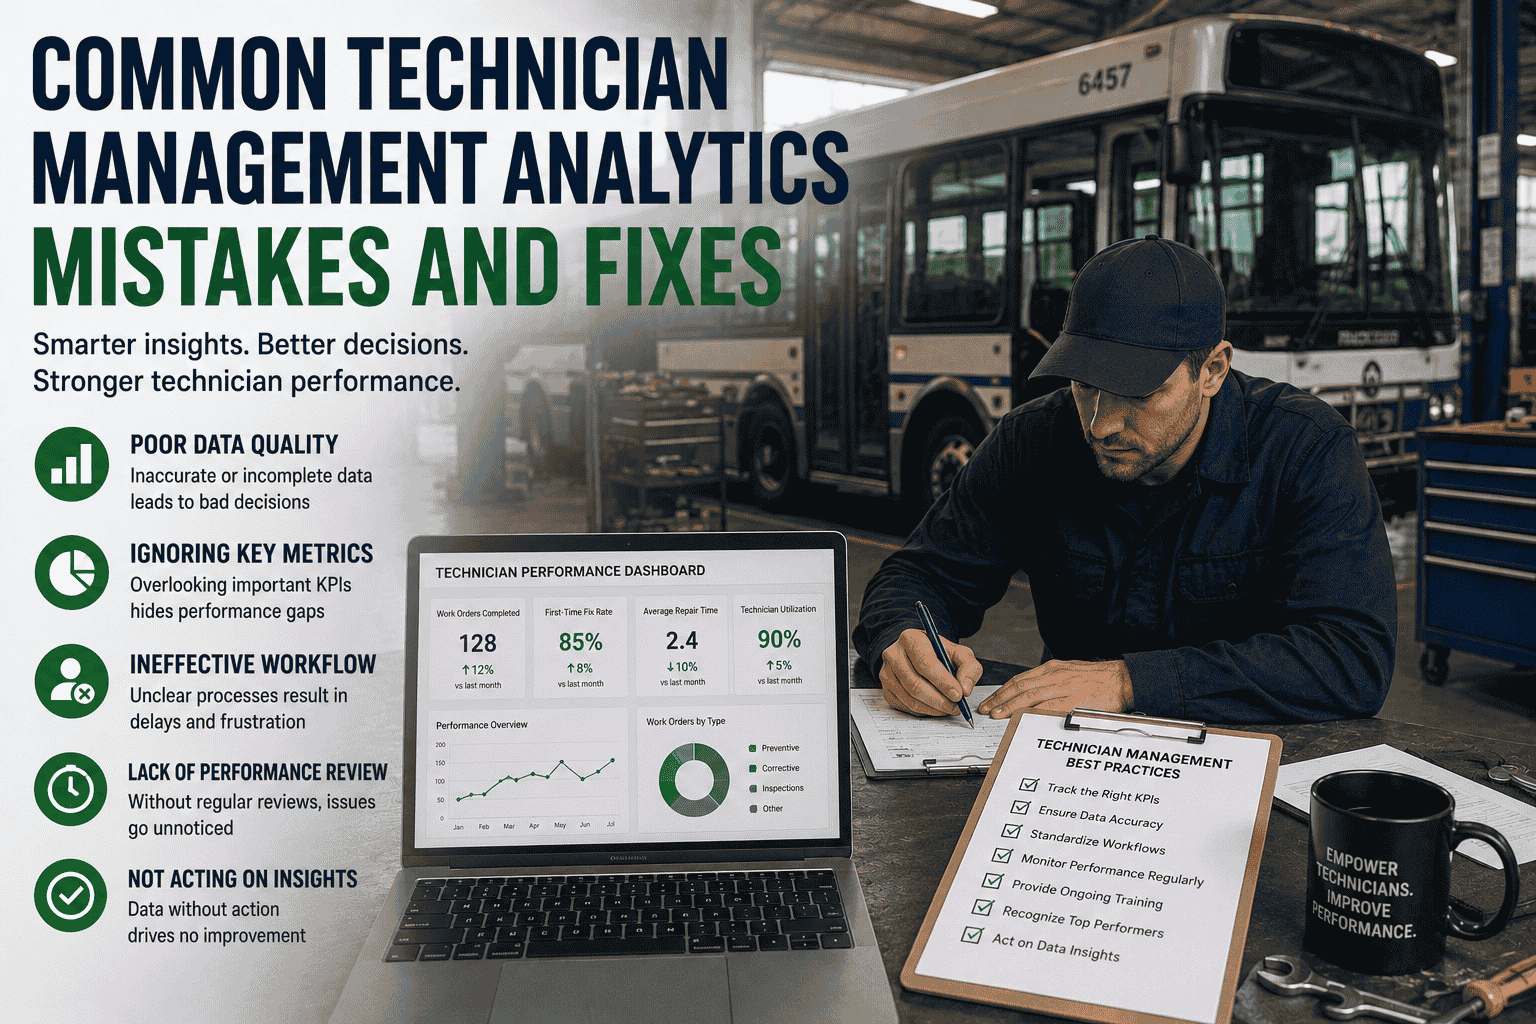
Technician management analytics is where maintenance leadership turns daily labor activity into better scheduling, higher wrench time, fewer repeat repairs, and lower operating costs. Many school bus and transit fleets collect work order data, but they still make technician decisions from gut feeling, incomplete spreadsheets, or simple hour totals. That creates blind spots. A technician may close many work orders but still have a high repeat repair rate. Another may complete fewer jobs because they are assigned the hardest diagnostics. A shop may look busy while actual wrench time is low because technicians are waiting on parts, approvals, or unclear assignments. In 2026, technician management analytics should measure productivity, quality, workload balance, skill utilization, backlog, overtime, and repair outcomes. This guide explains the most common technician analytics mistakes and how fleet managers can fix them with practical CMMS workflows, KPI dashboards, and better reporting habits.
Track wrench time, first-time fix rate, repair quality, backlog, labor cost, and technician workload with analytics that improve bus fleet reliability.
Bus maintenance teams are under pressure from technician shortages, higher labor costs, aging vehicles, electric bus adoption, and tighter compliance expectations. A fleet can no longer judge technician performance only by attendance or number of work orders closed. Those numbers do not show repair quality, diagnostic difficulty, waiting time, rework, parts delays, or whether the right technician was assigned to the right job.
Technician management analytics gives managers visibility into how maintenance work actually flows through the shop. It shows which technicians are overloaded, which repairs create repeat work, where labor hours are being lost, and which buses consume too much diagnostic time. When these insights are reviewed weekly, managers can reduce backlog, improve PM compliance, and build fairer technician schedules.
Total hours only show attendance. Wrench time shows how much of that time was spent doing actual maintenance work.
Fix: Track direct repair labor, waiting time, admin time, and parts-delay time separately.Repeat repairs reveal diagnostic gaps, incomplete procedures, poor documentation, or skill gaps.
Fix: Track repeat repairs by vehicle, component, technician, and repair type.High closure volume can hide low-quality work if repairs keep coming back.
Fix: Combine work order count with first-time fix rate and comeback percentage.Backlog grows quietly when low-priority work, PM tasks, and parts delays are not separated.
Fix: Track open work orders by priority, age, technician, and parts status.Without benchmarks, managers cannot tell whether performance is poor, average, or best-in-class.
Fix: Set shop targets for wrench time, PM completion, repair cycle time, and repeat repairs.Assigning every job to any technician creates delays when specialized diagnostics are required.
Fix: Track certifications, repair outcomes, training needs, and skill-based assignment history.Labor cost problems hide inside overtime, repeat repairs, waiting for parts, and admin work.
Fix: Break labor into direct repair, overtime, rework, waiting time, and administrative categories.The best technician dashboards show performance quality and labor efficiency together. Managers should avoid judging technicians from a single metric. A technician working on complex diagnostics may close fewer work orders but still deliver high-value work. A useful dashboard compares wrench time, first-time fix rate, PM completion, repeat repair rate, and work order closure quality.
Analytics should show whether the shop is improving over time. The simplest way to communicate progress is a monthly trend line for wrench time or technician efficiency. This helps leadership see whether process changes are working.
Scheduling improves when work orders are assigned by priority, technician skill, parts availability, and current workload. Without analytics, supervisors often assign work to whoever is available first. That can create delays if the technician lacks the right experience or if parts are not ready.
A CMMS should help rank work by safety severity, route impact, PM deadline, technician skill match, and labor capacity. The result is a more balanced shop schedule with fewer bottlenecks and fewer emergency overtime hours.
Defect or PM need is recorded.
Task is created with priority.
CMMS matches work to technician ability.
Labor, parts, and notes are captured.
Dashboard updates automatically.
Labor cost is not only technician pay. It includes overtime, repeat repairs, waiting for parts, and administrative time. A shop can look fully staffed while losing thousands of dollars every month because technicians are blocked by parts shortages or unclear assignments.
Technician analytics should improve decisions, not simply create more reports. Focus on wrench time, first-time fix rate, PM completion, repeat repairs, backlog reduction, and labor cost visibility. When managers use those KPIs weekly, technician schedules become fairer, repairs become faster, and fleet reliability improves.
Common technician management analytics mistakes usually come from tracking activity instead of outcomes. Work order counts, labor hours, and attendance are not enough. Fleet managers need wrench time, first-time fix rate, repeat repair rate, skill tracking, backlog aging, and labor cost visibility. A CMMS connects inspections, work orders, technicians, parts, labor, and reporting so maintenance leaders can reduce downtime, lower costs, and improve technician performance with reliable data.


