A 50-bus fleet spent $2.4 million annually on operations. The finance director knew the number. She didn't know the per-mile cost. Fleet A operated at $6.80 per mile. Fleet B operated at $4.20 per mile. Same size, same routes, same driver wages. The difference: one measured CPM obsessively, the other didn't measure at all. Cost per mile is the master metric. It tells you if fuel consumption is creeping up, if maintenance is becoming reactive, if your fleet is getting more expensive or more efficient. But calculating it correctly requires discipline. You have to include fuel, maintenance, labor, insurance, capital depreciation, and overhead. Many fleets calculate partial CPM — just fuel and oil changes. They miss 60% of the cost. Others bundle everything and can't see where costs are rising. This guide shows how to calculate true cost per mile, what to track, and how to use the metric to cut costs by 15-25%.
Know your true per-mile cost. Most fleets calculate partial CPM and miss 60% of expenses. Here's how to calculate it correctly and use it to cut costs.
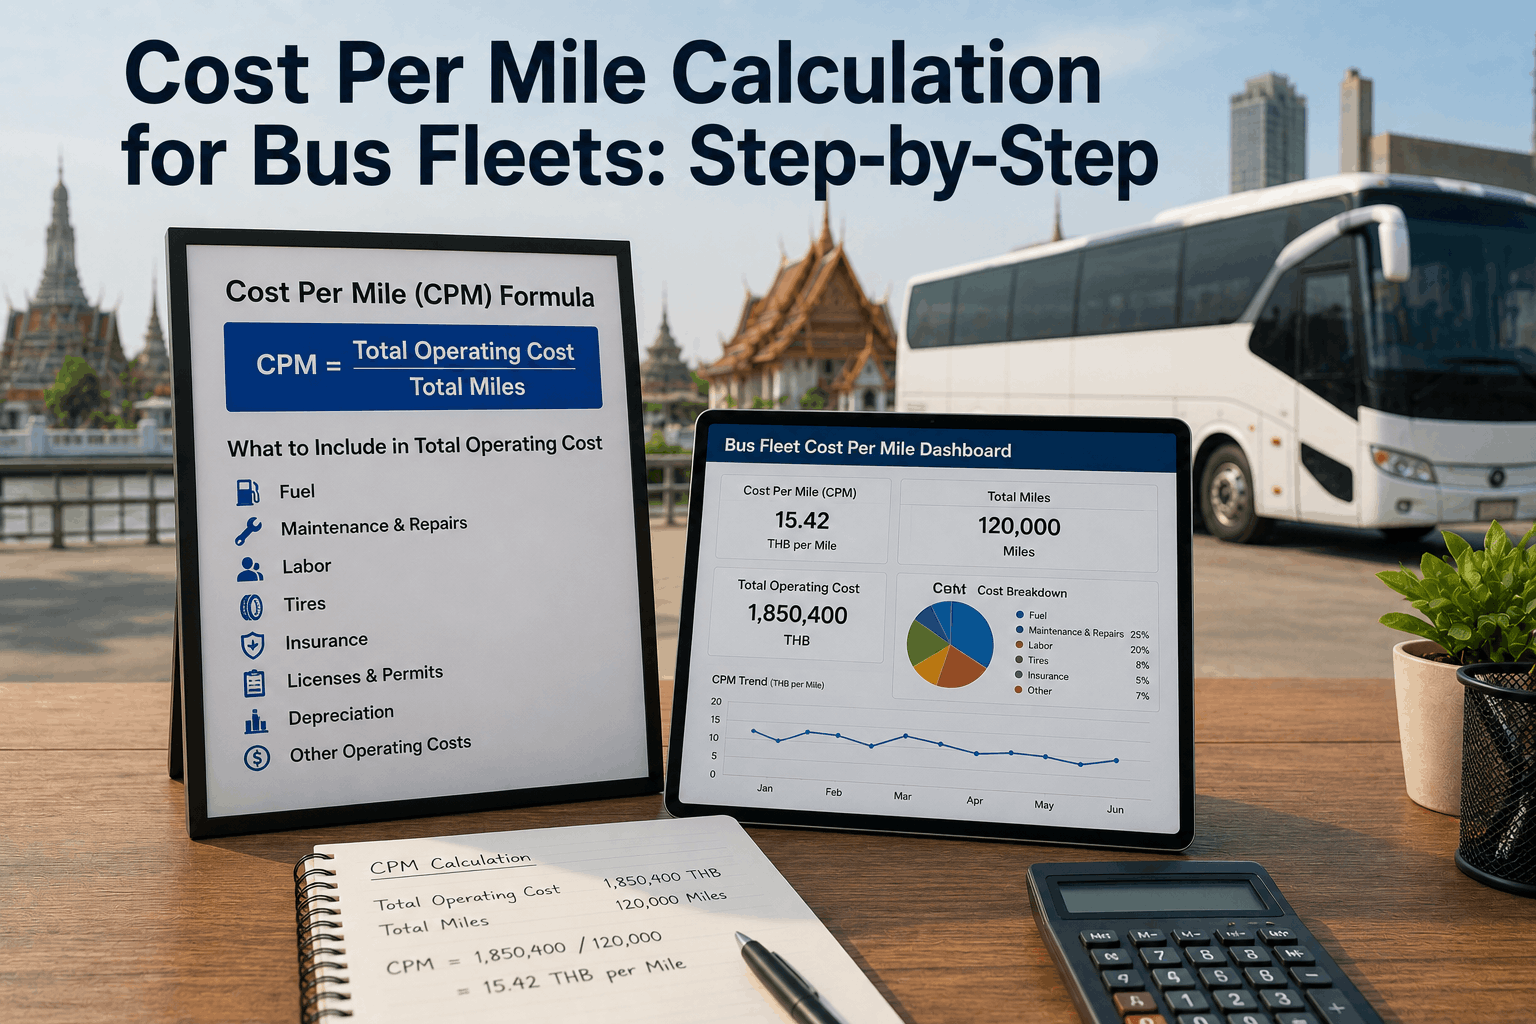
Cost per mile = Total Annual Operating Cost ÷ Total Annual Miles. But "total operating cost" trips up most fleets. You have to include seven categories: (1) Fuel (diesel, electric, natural gas). (2) Maintenance (parts, labor, fluids, filters, tires). (3) Labor (driver wages, dispatcher, shop labor). (4) Insurance (liability, collision, comprehensive). (5) Capital (bus depreciation or lease payment). (6) Overhead (facility rent, utilities, office salaries, management). (7) Tolls and permits. Many fleets calculate CPM using only fuel + maintenance. That's 40% of true cost. The other 60% — labor, insurance, capital, overhead — gets ignored. Result: you think you're at $3.20/mi when you're actually at $6.80/mi. You can't improve what you don't measure. True CPM requires all seven categories. Some fleets push back: "We can't allocate overhead fairly." Yes, you can. Divide annual facility cost by annual miles and add it. Overhead per mile is real.
CPM by itself is one number. CPM trended over 12-24 months tells a story. If your CPM rises from $5.20 to $5.80 in one year, something changed. Was it fuel prices (market-driven, uncontrollable)? Was it maintenance costs climbing (preventive → reactive)? Was it driver turnover driving wages up? Was it capital costs (older fleet aging faster)? Tracking CPM trends reveals what's moving. A fleet that trends CPM monthly can catch cost creep in month 2, not month 12. The cost of waiting: one year of excess costs. A 50-bus fleet paying an extra $0.50/mi for 12 months wastes $1.2 million in that year alone. Early detection matters. Most fleets calculate CPM once per year (for budgeting) and never look again. By the time they calculate the next year, costs have drifted 10-15%. Trend CPM monthly. Flag anything that rises more than 5% month-over-month. Investigate immediately. The longer you wait, the more it costs.
You've calculated your CPM. Now what? Is $5.80/mi good, bad, or average? That depends on your fleet type. Urban transit (frequent stops, short routes) runs 20-30% higher CPM than highway coach (long routes, highway speeds). School buses (low utilization, seasonal) run differently than charter (high utilization, year-round). A fair benchmark compares apples to apples. Your 50-bus urban transit fleet should benchmark against other 50-bus urban transit fleets, not against a 200-bus highway fleet. Industry benchmarks exist for five fleet types: (1) Public transit (urban, frequent stops). (2) Intercity coach (highway-focused, long routes). (3) School bus (seasonal, low miles/day). (4) Charter/tour (high utilization, premium service). (5) Shuttle (airport, hotel, short routes). Each has a different baseline CPM. Urban transit averages $5.40-$6.20/mi. Intercity coach averages $3.80-$4.60/mi. School bus averages $3.20-$4.00/mi. If you don't know your fleet type's benchmark, you're flying blind. Know your benchmark. Know where you stand relative to it. That gap is your improvement opportunity.
You know your CPM. You know the benchmark. You're $0.50/mi above target. Where do you cut first? Start with the biggest lever: fuel. Fuel is 25-30% of CPM in most fleets. A 10% fuel reduction saves $0.15-$0.18/mi immediately. How? Preventive maintenance keeps engines efficient (dirty oil, clogged filters = 8-12% fuel penalty). Route optimization cuts empty miles. Driver coaching reduces aggressive acceleration (3-5% fuel savings). Tire pressure management saves 2-3%. These aren't major overhauls — they're discipline. Second lever: maintenance. Reactive maintenance costs 50-300% more than preventive. Shifting from 80% reactive to 50% reactive saves $0.15-$0.25/mi. Third lever: labor utilization. If your fleet averages 85% utilization (miles per available seat mile), target 90%. Idle buses inflate CPM without any cost reduction. Fourth lever: capital efficiency. Older buses have higher depreciation and higher maintenance. A 12-year-old fleet might run $0.95/mi in capital costs. A 6-year-old fleet might run $0.75/mi. Sometimes it's worth replacing old buses. Fifth: overhead allocation. Consolidating facilities or reducing non-billable labor can trim overhead by 10-15%. Each lever has a different ROI timeline. Fuel improvements show up in month 1. Maintenance improvements show up over 6-12 months. Capital replacement shows up over 3-5 years. Attack all five simultaneously. One alone won't get you to benchmark. All five together get you ahead of it.
CPM becomes your decision-making tool. Should you replace a 10-year-old bus or repair it? Calculate the CPM impact of each option. Option A (repair): $8,000 repair, bus lasts 2 more years. Adds $3,000/year to maintenance cost. CPM impact: +$0.10/mi. Option B (replacement): $250,000 new bus, 10-year life. Capital cost $0.95/mi, maintenance drops $0.15/mi. Net CPM impact: +$0.80/mi for one year, then -$0.15/mi ongoing. Over 10 years, replacement wins. Should you buy or lease? Lease: fixed monthly cost. Buy: variable capital + maintenance cost. Lease is predictable; buy requires CPM analysis. If your fleet is volatile (utilization changes year-to-year), lease wins. If stable, buy wins. Calculate CPM for both scenarios and pick the lower one. CPM is the universal translator. Every operational decision ultimately impacts per-mile cost. Make CPM your decision framework.
Cost per mile isn't just a number for the annual report. It's the master metric that reveals what's actually happening in your fleet. If you calculate only partial CPM (fuel + maintenance), you're missing 60% of costs and flying blind. Calculate true CPM using all seven categories: fuel, maintenance, labor, insurance, capital, overhead, and tolls. Trend it monthly. Benchmark against your fleet type. When you see your CPM climbing or lagging your benchmark, you have a clear signal to investigate. The signal tells you what to attack: fuel optimization, maintenance efficiency, utilization, or capital decisions. Every improvement shows up immediately in the metric. CPM is the language your entire fleet speaks. When everyone understands the CPM target and their role in hitting it, cost discipline follows naturally.
Cost per mile is the master metric. Calculate it by including fuel, maintenance, labor, insurance, capital, overhead, and tolls. A 50-bus fleet at $5.80/mi is average. An efficient fleet operates at $4.20/mi. The gap is $1.60/mi — that's $1.92 million annually on a typical fleet. Trend CPM monthly to catch cost creep early. Benchmark against your fleet type to understand if you're competitive. Attack the five levers (fuel, maintenance, utilization, capital, overhead) to improve. Every $0.10/mi improvement saves $120,000 on a 50-bus fleet. The question isn't whether you can afford to focus on CPM — it's whether you can afford not to. CPM discipline separates profitable fleets from struggling ones.


