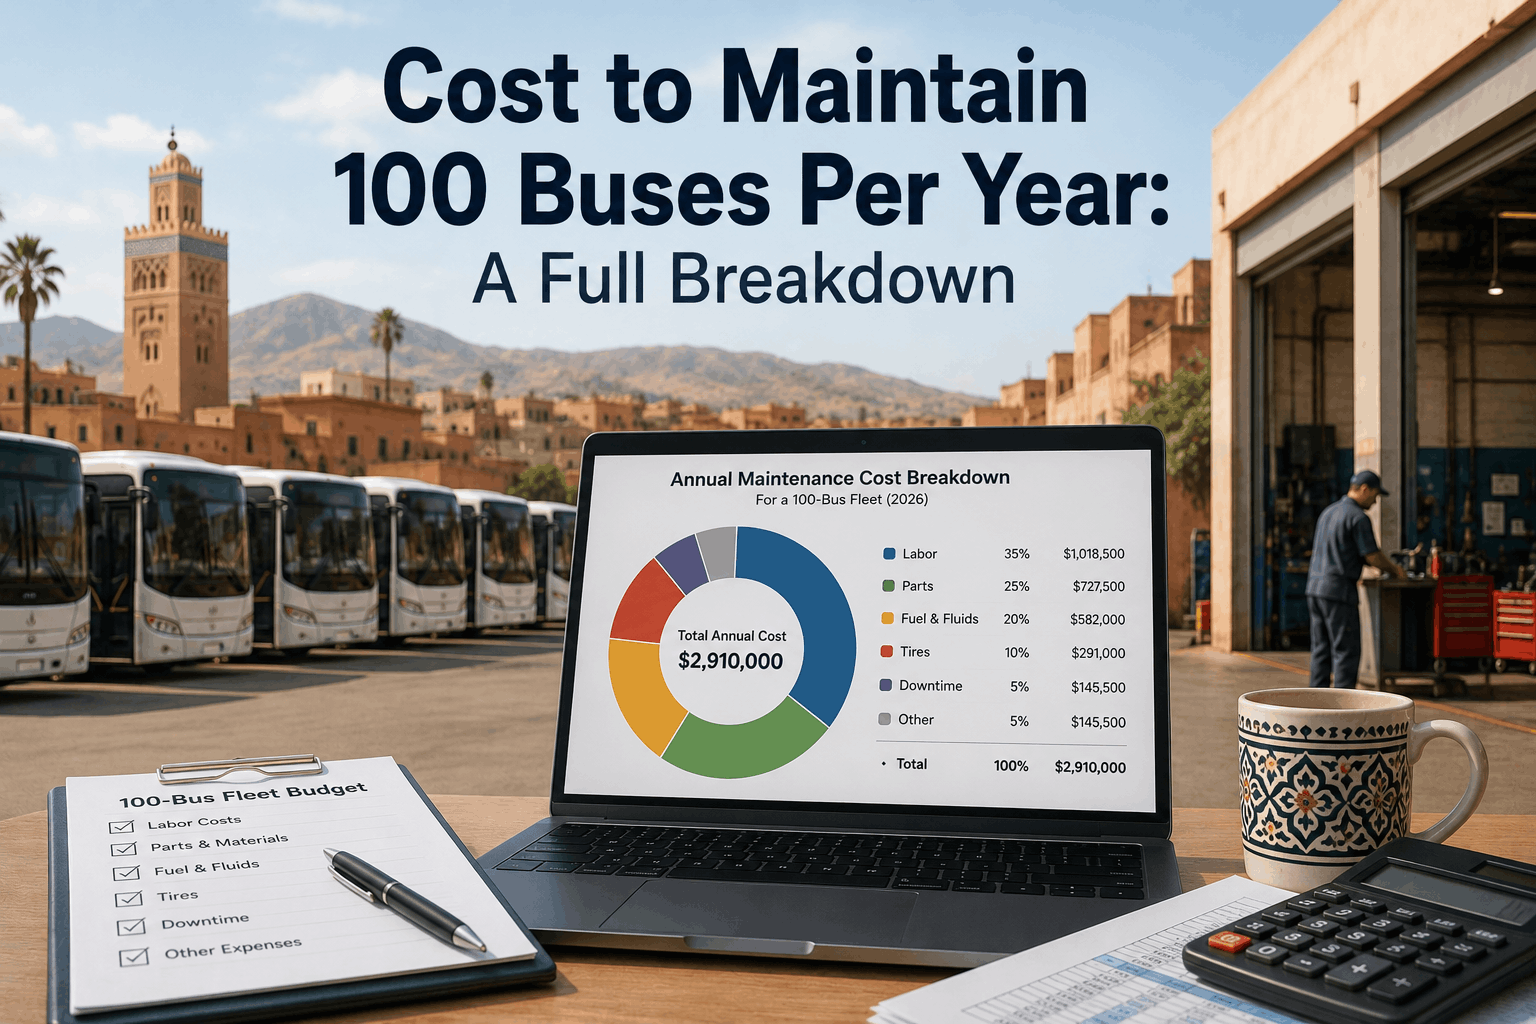
A 100-bus fleet in the Midwest budgeted $2.2M for annual maintenance. After the year ended, actual spending was $2.87M — a $670,000 overage. The surprise wasn't mechanical failures or parts inflation. It was visibility. They'd never mapped cost by category (labor vs. parts vs. parts labor vs. downtime), by vehicle age, or by component (engine, transmission, brakes, electrical). They couldn't see which buses were costing 3x the fleet average. They couldn't identify which maintenance categories were growing faster than others. And they had no way to know if $2.87M was high or low for a 100-bus fleet. Here's what a realistic 100-bus annual maintenance budget looks like in 2026, broken down by category, and how to control each one.
Labor, parts, fuel, downtime, contingency. Here's where your $2.5–$3.2M goes and how to control it.
For a 100-bus fleet, labor typically represents 35–45% of total maintenance cost — roughly $875,000–$1,440,000 annually. This assumes an average shop team of 8–12 full-time technicians at fully-loaded cost (salary + benefits + payroll tax, typically $65–85K per technician per year). The variable here is utilization. A fleet with efficient scheduling, minimal roadside work, and good preventive maintenance gets 75–85% utilization (technician hours spent on billable work vs. admin/waiting). A fleet with reactive maintenance, frequent roadside calls, and poor planning gets 55–70% utilization. A 10-percentage-point difference in utilization on a $1.2M labor budget is $120,000 per year. The gap widens with larger roadside technician teams. Management lever: PM scheduling discipline. Fleets that execute scheduled PM consistently pay less total labor because they reduce emergency calls that require overtime, travel, and inefficient roadside work.
Parts and component replacement typically represent 30–40% of total maintenance cost — roughly $750,000–$1,280,000 for a 100-bus fleet. This breaks into recurring items (air filters, belts, fluids, brake pads) and major components (engines, transmissions, turbochargers, radiators). For a diesel bus averaging 8–10 years old, expect: air/fuel filter service $400–600/bus/year; fluid replacements (oil, coolant, hydraulic) $600–800/bus/year; brake pad/liner replacement $1,200–1,800/bus/year; and major component failures (engine, transmission, turbo) $4,000–8,000/bus for the unlucky few. The budget lever is preventive maintenance discipline. A bus that gets religiously maintained at prescribed intervals stays within the recurring parts budget. A bus with deferred air filter changes and brake inspections generates $15,000+ in emergency parts and labor when a filter restriction finally causes a breakdown or brake failure. For 100 buses, the difference between diligent and reactive parts spending is $200,000–400,000 per year.
Downtime cost is often omitted from maintenance budgets — which is why budgets surprise fleets when reality arrives. A bus in the shop for 24 hours (common for major repairs) loses revenue. For a transit bus averaging 40–50 passenger trips per day at $2–3 per rider, that's $80–150 per day in lost revenue. For a charter bus doing a full-day trip, it's $1,200–2,000. A 100-bus fleet running transit with 10–15% annual downtime rate (typical, not uncommon) losses $200,000–400,000 per year in lost fares. Charter and school fleets lose similar amounts in trip cancellations and reputational damage. The management lever is reducing breakdowns and repair duration. Fleets with excellent PM and accurate diagnostics get 5–8% downtime. Reactive fleets hit 15–25%. A 100-bus fleet reducing downtime from 15% to 8% saves roughly $140,000–280,000 per year.
Fuel and fluid costs (diesel, oil, coolant, brake fluid, transmission fluid, hydraulic fluid) typically account for 10–15% of maintenance budget — roughly $250,000–$480,000 for a 100-bus fleet. Fuel is the largest component: 100 diesel buses consuming 5,000–7,000 gallons per month (depending on routes) at $3.20–3.50 per gallon is $1.92M–$2.94M per year for fuel alone (though that's often considered operations, not maintenance). Fluids and consumables add $100,000–200,000. The lever here is efficiency, not just price. A fleet reducing per-mile fuel consumption through better PM (air filter maintenance, fuel system service, engine calibration) saves more in fuel cost than they can negotiate from vendors. An average fleet spends $2,500–3,500 per bus per year on fuel. A fleet with exceptional PM can cut that to $2,200–$2,800. For 100 buses, that's $70,000–150,000 per year difference.
A responsible 100-bus fleet budget starts with data from your fleet, not industry averages. Industry averages ($25K–$32K per bus) are starting points, not targets. Here's the framework:
100-bus fleet maintenance budgets of $2.4M–$3.2M are realistic for 2026, but only if broken down by category and tracked with discipline. The single biggest variable is downtime cost, which most fleets underestimate because it's not a line item in the maintenance budget — it's a line item in lost revenue that never shows up in the same spreadsheet. Fleets that link maintenance costs to downtime (by vehicle, by breakdown cause, by technician) discover that $150K–$200K investments in better PM discipline return $300K–$500K per year in downtime reduction. The control levers are: labor utilization (target 75%+), parts spending discipline (catch deferred PM before it becomes emergency), downtime reduction (through PM and diagnostic accuracy), and fuel efficiency (through PM execution). BusCMMS tracks all four in one platform with cost reporting that shows impact by category.
A 100-bus fleet spends $2.4M–$3.2M per year on maintenance when all costs are included. The budget breaks into five categories: labor ($1.0M–$1.3M), parts ($750K–$1.1M), fuel ($250K–$450K), downtime ($150K–$300K), and contingency ($250K–$450K). The control lever for each category is different — labor efficiency comes from PM discipline, parts cost comes from deferred maintenance prevention, downtime cost comes from breakdown reduction and diagnostic accuracy, and fuel cost comes from preventive maintenance execution. Fleets that track spending by category, measure downtime in real dollars, and link all four to specific actions (PM compliance, parts usage, technician utilization, fuel consumption) can identify $200K–$400K per year in savings or reallocation opportunities. Most fleets discover these opportunities by accident, or not at all. BusCMMS gives you the data to find them systematically.


