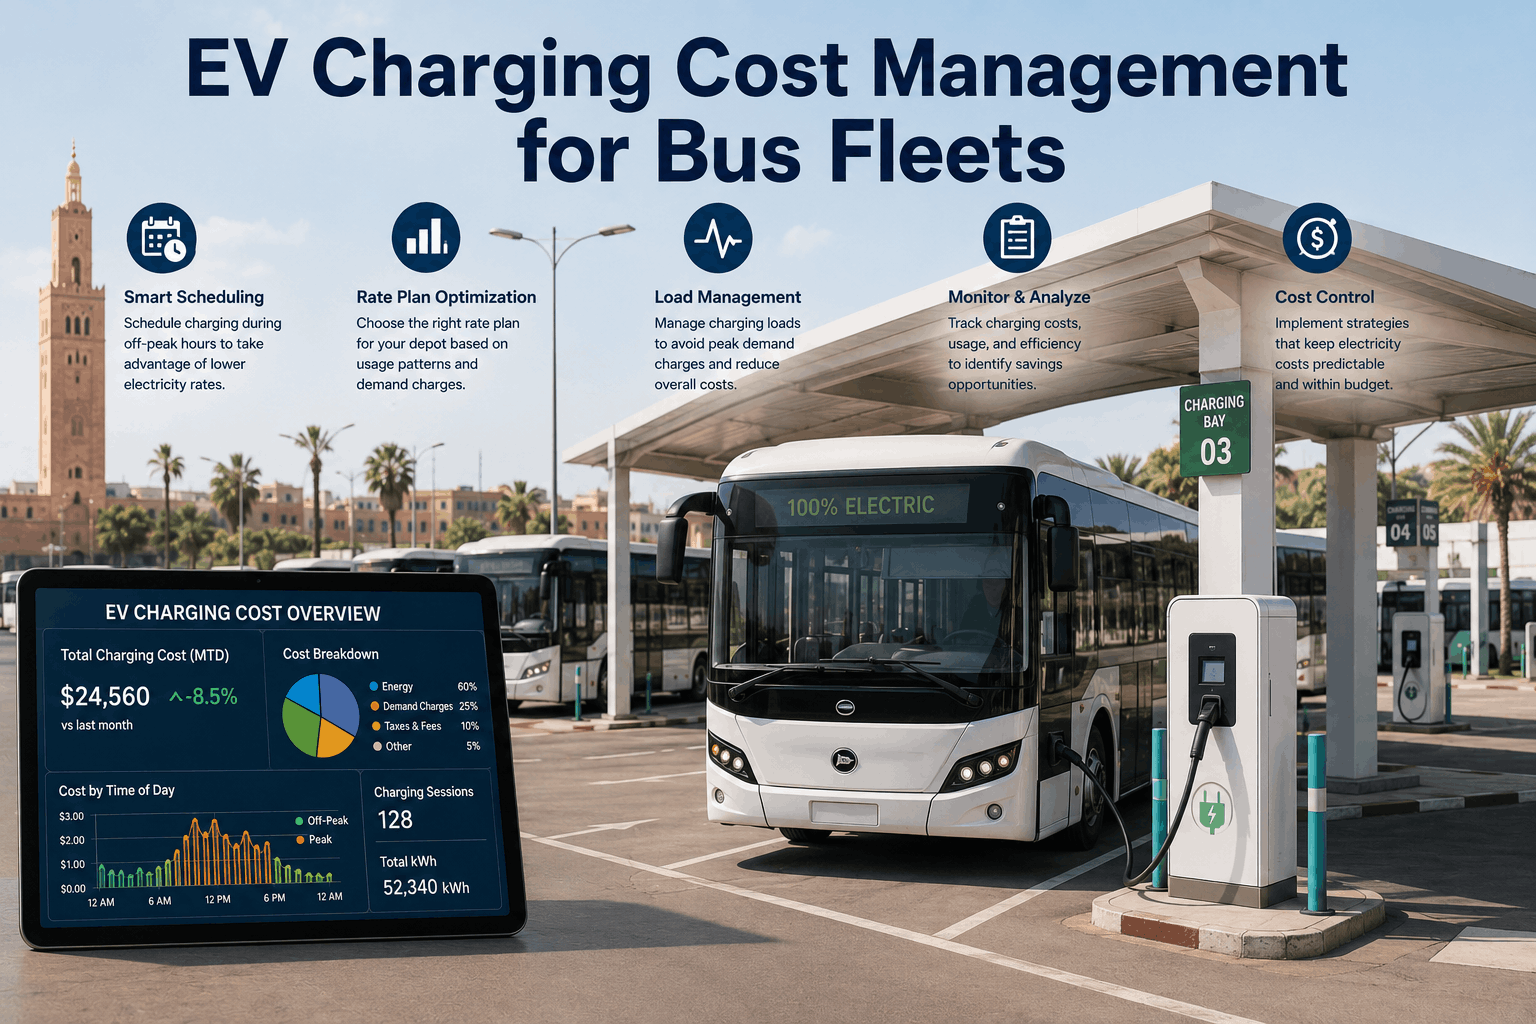
A 50-bus fleet converted 10 buses to electric. Budgeted for electricity costs: $0.12/kWh × 100 kWh/day × 250 days = $3,000/month. Actual cost: $8,500/month. Why the 183% overrun? Demand charges. Electricity rates have two components: energy charges ($/kWh) and demand charges ($/kW of peak demand). A small utility will bill you for energy at $0.12/kWh. But they'll also charge $15-30 per kW for the highest 15-minute block of power you draw that month. Charge all 10 buses simultaneously at 6pm (peak hours), you're drawing 300 kW. That's $4,500-9,000 in demand charges alone. Most fleet managers don't understand this. They see electricity as a simple commodity ("it costs $0.12/kWh") when it's actually a time-based, capacity-based cost. Managing EV charging cost isn't about electricity — it's about load management, time-of-use optimization, and rate structure negotiation. This guide shows how to cut EV charging costs by 30-40% without buying cheaper electricity.
You're not paying for electricity. You're paying for peak demand. Manage the demand curve and cut costs 30-40%. Most fleets don't know this.
Electricity rates have two tiers: (1) Energy charge: $/kWh (what you consume). (2) Demand charge: $/kW (your peak 15-minute consumption in the billing period). Example: Your utility bill says "$0.12/kWh and $18/kW demand." You charge 10 buses at 30 kW each from 6pm–10pm (4 hours). Energy consumed: 10 buses × 30 kW × 4 hours = 1,200 kWh. Energy cost: 1,200 × $0.12 = $144. But your peak demand was 300 kW (all 10 buses charging together). Demand charge: 300 kW × $18/kW = $5,400. Total: $5,544. That 4-hour charging session that you thought cost $144 actually costs $5,544. A 38x multiplier due to demand. Now scale to a month: if you charge all 10 buses every evening at peak hours, you hit 300 kW demand every single month. That's 300 × $18 × 12 months = $64,800/year just from demand charges. Charge the same buses but stagger them (5 buses 6pm-8pm, 5 buses 8pm-10pm), your peak demand drops to 150 kW. Demand cost: 150 × $18 × 12 = $32,400/year. You just saved $32,400 by staggering. Same energy consumed, half the cost. This is the opportunity most fleets miss.
Most utilities have time-of-use (TOU) rates: peak (2pm–9pm, high cost), partial-peak (9am–2pm and 9pm–midnight, medium cost), and off-peak (midnight–6am, lowest cost). A 10-bus fleet charging during peak hours at $0.20/kWh costs far more than charging during off-peak at $0.08/kWh. Example: 10 buses × 100 kWh each = 1,000 kWh per night. Peak charging (6pm): 1,000 × $0.20 = $200 + demand charges. Off-peak charging (2am): 1,000 × $0.08 = $80 (demand charges are lower off-peak too, maybe $5/kW instead of $18). Shift to off-peak and you cut energy cost by 60% and demand cost by 70%. Annual savings: $100,000+ for a 10-bus fleet. But off-peak charging requires overnight charging capability. Your buses need chargers that can deliver their daily range (typically 200-300 miles) overnight (6-8 hours). Most Level 2 chargers can do this. Some can't. If your chargers are too slow for overnight full-charge, you have two options: (1) upgrade to faster chargers (cost: $50K-100K per charger). (2) Use a hybrid approach: slow overnight charging during off-peak (gets you 80% of range), supplement with some partial charging during partial-peak (cheaper than peak). Option 2 is usually more cost-effective. The point: understand your utility's TOU rates, design your charging to happen during off-peak windows, and time it so buses are ready for service by morning.
You can't shift all charging to off-peak if your buses are in service during the night. But you can shift some and stagger the rest. Strategy: (1) Schedule 50% of buses to charge during off-peak (midnight–6am). These buses are back at base and available. (2) Schedule remaining 50% during partial-peak (9pm–midnight or 6am–9am). These buses arrive later or depart earlier. (3) Reserve peak-hour charging only for emergency top-ups or buses that need immediate turnaround. Example for a 10-bus fleet: Buses 1–5: charge 2am–6am (full overnight charge, off-peak). Buses 6–10: charge 9pm–midnight (after evening shift, partial-peak). If you need emergency boost for a specific bus, use a 30-minute Level 3 (DC fast) charge during the day (cost: ~$30). By staggering, your peak demand drops from 300 kW (all 10 simultaneous) to 150 kW (5 simultaneous). Demand charge savings: $32,400/year. Plus energy savings from TOU optimization: $20,000/year. Total: $52,400/year for a 10-bus EV fleet. For a 50-bus fleet, scale these numbers by 5x. You're looking at $250K+ annual savings through load shifting and TOU optimization.
For fleets with high peak demand (and therefore high demand charges), battery storage can reduce demand charges dramatically. Concept: install a battery system that charges during off-peak (cheap electricity) and discharges during peak hours (replaces expensive peak electricity). Example: 100 kWh battery system. Charge at 2am (off-peak) for $8 (100 × $0.08). Discharge at 6pm (peak) to avoid drawing from grid, saving $20 (100 × $0.20). Net savings: $12 per cycle. Over 250 charging cycles per year: $3,000/year. But the battery costs $30K–50K. Payback: 10–17 years. Not ideal for most fleets. However, some utilities offer demand response programs that pay you to reduce peak demand. If your utility offers this (common in California, Texas, New York), the payback improves to 4–7 years. At that point, battery storage makes financial sense. For most fleets without demand response incentives, peak shaving is overkill. Focus on TOU optimization and load shifting first. Those are free or low-cost and deliver 60–70% of the savings. If demand charges are still your biggest cost (despite optimization), then consider battery storage as phase 2.
Most utilities have published rates, but large customers (20+ buses, 500+ kW peak demand) can negotiate. Strategies: (1) Contract locking: ask your utility for a multi-year rate lock (hedge against rate increases). (2) Voluntary demand response: offer to reduce peak demand in exchange for lower rates. If you voluntarily keep peak demand below 200 kW, some utilities offer 10–15% off demand charges. (3) Interruptible tariff: offer to pause charging during grid emergencies in exchange for lower rates. (4) Aggregated solar/wind: if your facility or nearby facilities have solar, you may qualify for lower rates (utility solar programs). A 50-bus EV fleet with smart load management and negotiated rates can achieve $0.08–$0.10/kWh all-in (including demand charges amortized). Compare to diesel at $2.50–$3.50/gallon. A bus doing 5 MPG diesel = $0.50–$0.70/mile. A bus doing 1.5 miles/kWh electric = $0.05–$0.07/mile. Even at higher electricity rates, EV is cheaper. But with optimization and negotiation, EV becomes 60–70% cheaper than diesel long-term.
EV fleets cost more to operate than diesel fleets if you don't manage electricity strategically. The culprit isn't the electricity itself — it's demand charges. Simultaneous charging drives peak demand up. Peak demand is charged at $15–30/kW. That's 2–4x more expensive than energy charges ($/kWh). A fleet that charges all buses at 6pm (peak grid hours) pays far more than a fleet that charges at 2am (off-peak). Same electricity consumed. 3x higher cost. Manage the demand curve through TOU optimization (charge during cheap hours) and load shifting (stagger charging across multiple time windows). Add smart chargers with scheduling, and you can automate this. Most EV fleets achieve 30–40% fuel cost reduction vs diesel. But optimization-focused fleets achieve 50–70%. The difference: discipline around charging timing, rate structure understanding, and smart charger investment.
EV charging cost isn't about electricity price — it's about demand management. Electricity bills have two components: energy ($/kWh, what you use) and demand ($/kW, your peak consumption). Demand charges are 2–4x larger than energy charges and are the hidden cost killing your EV fleet economics. Manage the demand curve: (1) Shift charging to off-peak hours (midnight–6am) where rates are 50–60% cheaper. (2) Stagger charging so not all buses charge simultaneously (drop peak demand from 300 kW to 150 kW = 50% demand charge savings). (3) Invest in smart chargers with load management (pay for themselves in 3–6 months through demand reduction). (4) Negotiate multi-year rates with your utility. A 10-bus EV fleet can save $50K+ annually through these strategies. A 50-bus EV fleet can save $250K+ annually. These aren't efficiency games — they're real money. Most fleets leave this savings on the table because they don't understand demand charges. You now do.


