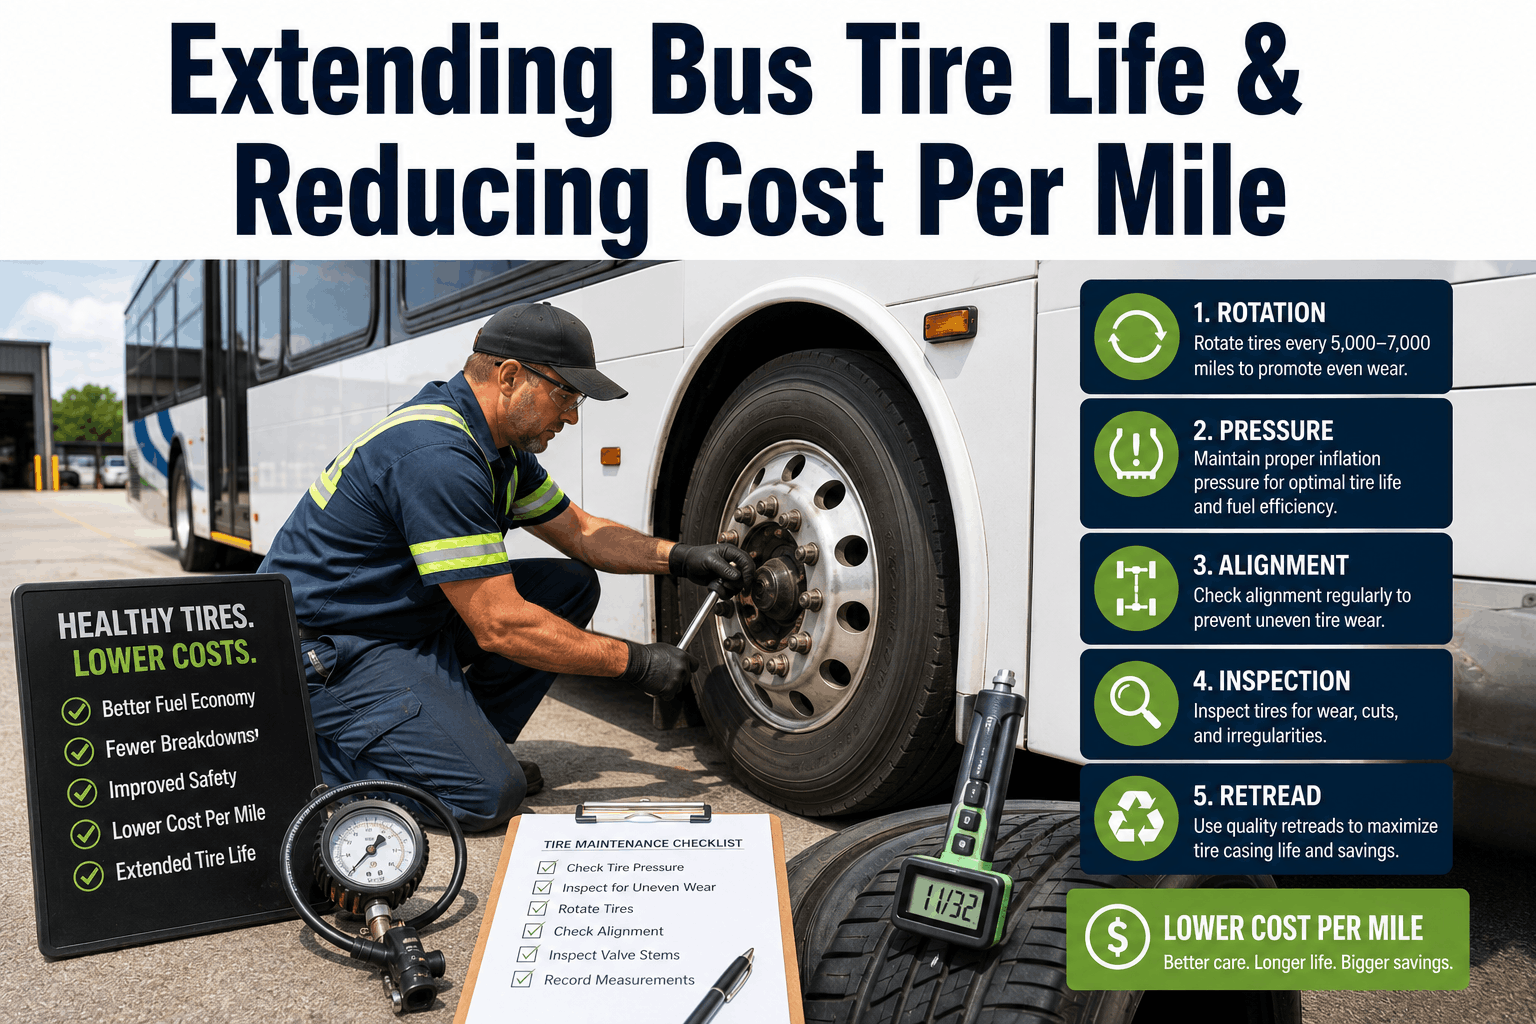
A 100-bus fleet paying $85 per tire for replacements across 400 tires per rotation cycle spends $34,000 on tire purchases alone. That same fleet implementing rotation, pressure management, and retreading strategies cuts average tire life from 35,000 miles to 65,000 miles. That's not doubling the life. That's cutting tire cost per mile by 45%. Tires are one of the most controllable costs in fleet operations, yet most operators treat them reactively — replacing them when they fail. Tires don't fail randomly. They fail predictably, based on pressure, alignment, rotation, and load distribution. Every one of these is manageable. Tire cost reduction isn't about buying cheaper tires. It's about extending the life of the ones you have. Here's how high-performing fleets do it.
Extending Bus Tire Life & Reducing Cost Per Mile
Tires are a controllable cost. Learn rotation, pressure, alignment, and retread strategies that extend bus tire life and cut cost per mile.
Bus tires are capital-intensive. A full set of tires (10 tires per bus × fleet size) represents a significant upfront investment: $850–$1,100 per bus depending on tire quality and size. Over a 10-year fleet lifecycle, tire replacement is one of the largest controllable maintenance expenses. Yet most fleets treat tire management reactively. They wait for tires to wear out or fail, then replace them. They don't rotate tires on a schedule. They don't monitor pressure. They don't track tread depth. They don't consider retreading. The result: average tire life of 35,000–45,000 miles. That number is not inevitable. It's the product of neglect. Fleets implementing disciplined tire management routines — rotation, pressure checks, alignment, load distribution — routinely extend tire life to 60,000–80,000 miles. That's a 40–75% extension. For a 100-bus fleet operating 45,000 miles per year with 10 tires per bus, the difference is: Reactive fleet: 400 tires ÷ 40,000 miles average = 10 tire replacements per bus per year. Cost: $425 per bus annually in tire replacement alone. Proactive fleet: 400 tires ÷ 70,000 miles average = 5.7 tire replacements per bus per year. Cost: $242 per bus annually. Difference: $18,300 saved annually across the fleet. That's not accounting for retread opportunities, which cut the cost further. The gap isn't about tire quality. It's about discipline.
Tire rotation is the single most effective tire life extension strategy available to fleet operators. It's also the most neglected. A bus tire on the steering axle wears 15–25% faster than a tire on a drive or trailer axle due to steering input, weight transfer during turns, and higher braking force. Left unmanaged, front tires wear out while rear tires still have 30–40% tread depth. Rotating tires periodically redistributes the wear, extending overall fleet tire life 25–35%. The protocol used by high-performing fleets: rotate tires every 12,500–15,000 miles. This means a bus reaching 40,000 miles gets rotated 2–3 times before the first tire is replaced. The rotation pattern matters. Most fleets use a figure-8 pattern: front-left to rear-right, front-right to rear-left, rear-left to front-left, rear-right to front-right. This distributes steering and braking wear evenly. Tire rotation takes 2–3 hours of labor per bus per rotation, depending on tire size and equipment. For a fleet, this is a high-volume, low-complexity task. Smart fleets do it routinely, on schedule, during preventive maintenance windows. Reactive fleets skip it because it seems optional. The cost-benefit is stark: rotation labor = $150–$200 per bus per rotation. Extended tire life value = $400–$600 per bus (from 40k to 60k+ mile lifespan). Net benefit: $200–$400 per rotation. For a bus operating 45,000 miles per year, that's 3 rotations worth $600–$1,200 in tire life extension annually. Rotation is not optional. It's the highest-ROI tire maintenance activity available.
Tire pressure is the most critical variable for tire longevity, yet it's often ignored. Tires lose pressure naturally — 1–2 PSI per month depending on temperature and rubber permeability. A tire that starts at 100 PSI cold can drift to 95 PSI in a month without being driven hard. A bus operating for 6 months between pressure checks can have tires running at 85 PSI when they should be at 100 PSI. The impact is severe. A tire running 10 PSI low increases rolling resistance by 15–20%, generates excess heat (speeding rubber degradation), and cuts tire life by 30–40%. Under-inflation is a silent killer. Most drivers don't notice performance degradation until the tire is severely compromised. Most operators don't track pressure systematically. High-performing fleets treat tire pressure like fuel economy. They check pressure weekly, they adjust to specification, and they investigate any tire losing pressure faster than expected (possible slow leak). The standard is: cold tire pressure checked to within 2 PSI of specification, weekly minimum. Some advanced fleets install TPMS (Tire Pressure Monitoring Systems) on vehicles, which sends pressure alerts automatically when any tire drops 5+ PSI below spec. This catches slow leaks before they become tire failures. The cost of TPMS is $200–$400 per bus installed. The value is preventing one premature tire failure = $300–$500. For a fleet, TPMS breaks even in one year. For fleets without TPMS, the protocol is manual checks tied to pre-trip inspections or PM schedules. Weekly pressure verification should be non-negotiable. It costs 5 minutes per bus. It prevents tire failures worth $300+ each.
Wheel alignment affects tire wear more than many operators realize. A bus with camber (vertical wheel angle) off by just 0.2° can increase tire wear by 20–30%. A bus with toe-in (horizontal wheel angle) off by 0.1° can increase wear by 15–25%. Cumulative effect: poor alignment cuts tire life by 40–60%. The solution is simple: alignment checks every 12–18 months or after any significant impact (pothole, curb strike, collision). An alignment check and correction costs $300–$500 per bus. One prevented early tire replacement = $350+. The break-even is immediate. For fleet operators, alignment is often overlooked because results aren't visible. Tires wear silently. By the time the wear is obvious, the tire is already compromised. Proactive fleets build alignment checks into PM schedules. They align buses on a 15-month cycle. Load distribution is a secondary factor but important for heavy-use fleets. A bus exceeding rated load capacity puts disproportionate stress on tires, reducing life by 20–40%. For fixed-route operations, this is less common, but for shuttle or charter services with variable loads, weight tracking can extend tire life. Weigh buses quarterly during PM and ensure load stays within specification. For most fixed-route fleets, alignment discipline alone adds 15–25% to tire life. Combined with rotation and pressure management, alignment contributes to the 40–75% life extension that separates high-performing from average fleets.
Retreading is the most cost-effective tire life extension strategy available to bus operators, yet adoption remains low due to misconceptions about safety and quality. Modern retreads are indistinguishable from new tires in performance. They're manufactured using the same rubber composition and quality standards as new tires. A good retread costs $45–$65 per tire. A new tire costs $95–$120. For bus operators, retreading the same casing 2–3 times before final retirement can cut long-term tire cost per mile by 50%. The retread decision is simple: if a casing (the tire body after tread is worn) is structurally sound — no belt damage, no sidewall degradation, no internal separation — it can be retreaded. A tire with 50,000–60,000 miles on it with even wear and no damage is a candidate. A casing that has failed (belt separated, sidewall cracked, inner liner compromised) cannot be retreaded and must be scrapped. For fleets rotating and maintaining pressure discipline, the typical outcome is: tires reach end-of-life (2/32" tread depth) at 60,000–70,000 miles with casing still sound. That casing gets retreaded, returning to service for another 40,000–50,000 miles. One original tire casing generates two full tire lives: original (60k miles) + retread (45k miles) = 105,000 miles total. Cost: $95 (new) + $55 (retread) = $150 total. Cost per mile: $1.43. Without retreading: buy two new tires at $95 each = $190 for 105k miles = $1.81 per mile. Retread saves $0.38 per mile, or 21%. For a 100-bus fleet with 1,000 tires per complete rotation, retreading one set of casings saves $38,000. That's just one retread cycle. Most fleets get 2–3 retread cycles per original casing.
Tire cost is the most controllable maintenance expense in bus operations. The difference between reactive tire management (average life 35k miles, 100% replacement cost) and proactive management (average life 70k miles, 50% replacement cost) is discipline, not dollars. Rotation every 12,500 miles, pressure checks weekly, alignment every 15 months, and retread strategy when casings are sound. These four practices extend tire life from 40,000 to 70,000+ miles and cut tire cost per mile by 45–55%. A 100-bus fleet implementing this program saves $28,000–$45,000 annually. BusCMMS tracks tire history by vehicle, alerts on rotation due dates, flags tire pressure anomalies, and surfaces candidates for retreading — making tire cost management automatic.
Tires don't fail randomly. They fail because of under-inflation, no rotation, misalignment, and overload — all preventable. Average bus tire life of 35,000–45,000 miles isn't inevitable. It's the product of reactive management. Fleets implementing disciplined tire management routines (rotation every 12,500 miles, weekly pressure checks, alignment every 15 months, retread strategy) routinely extend tire life to 70,000–80,000 miles. That's a 40–75% extension in service life. Combined with retreading sound casings, the long-term cost per mile for tires drops 45–55%. For a 100-bus fleet operating 45,000 miles per year, that's $28,000–$45,000 in annual savings. Tire management is the highest-ROI maintenance discipline available to fleet operators. BusCMMS tracks tire history, schedules rotations and pressure checks, and identifies retreading candidates — automating the discipline that most fleets lack.


