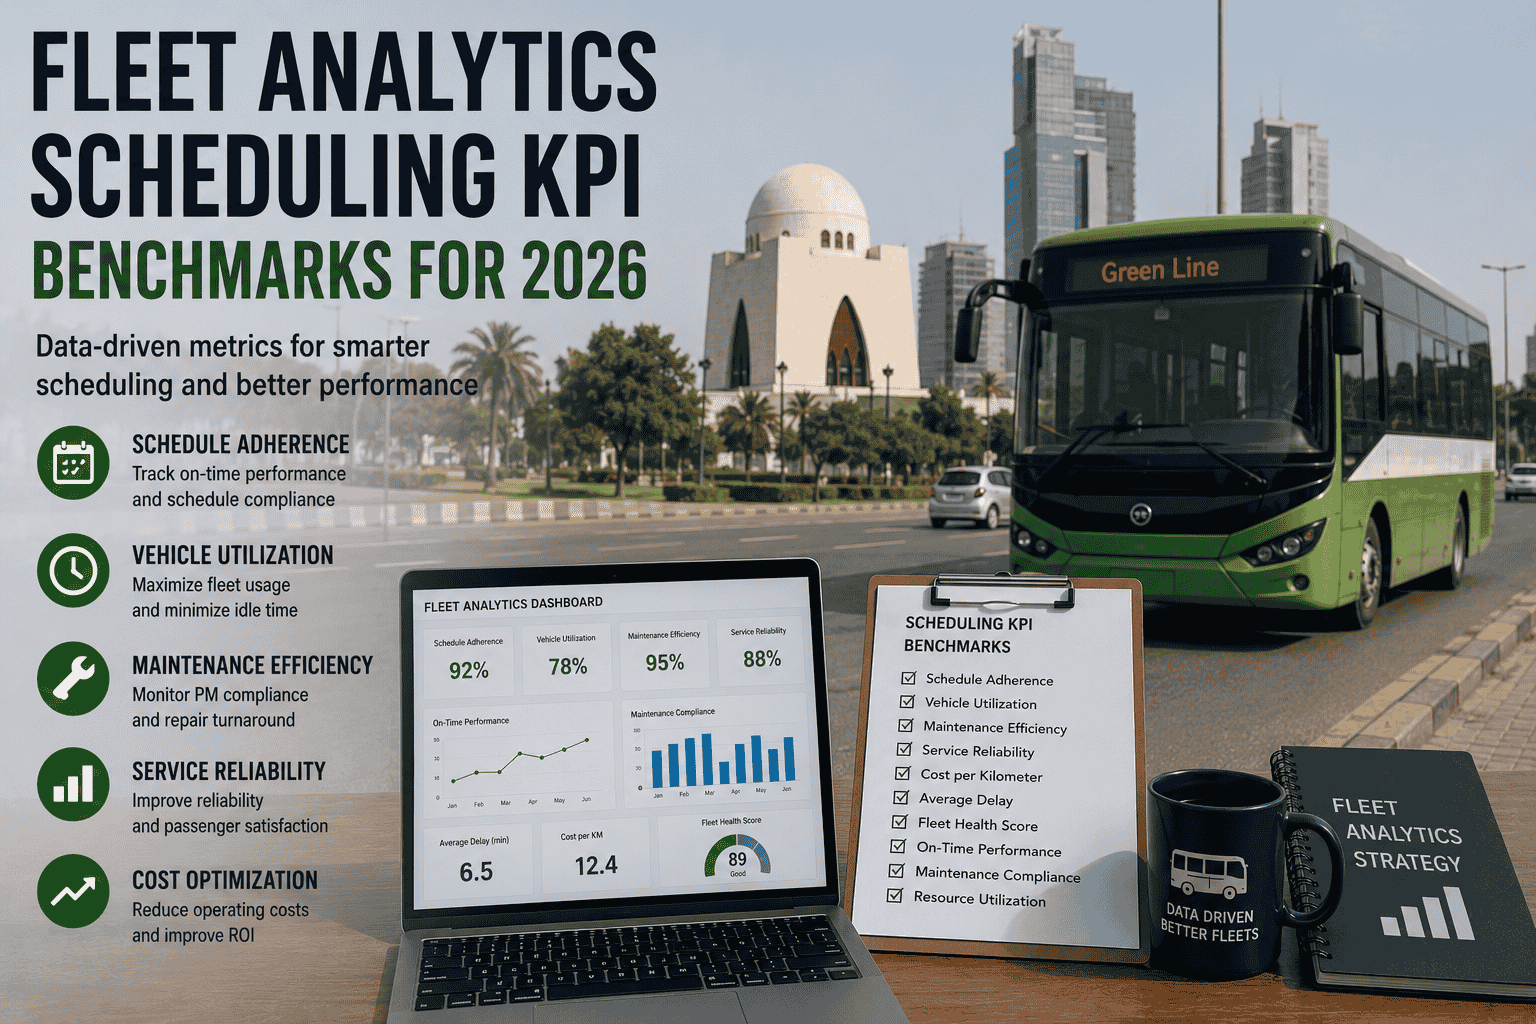
Fleet analytics scheduling is no longer just a reporting task for year-end reviews. In 2026, bus fleet managers need scheduling KPIs that show whether buses are available, technicians are assigned efficiently, preventive maintenance is completed on time, and service disruptions are being reduced before they affect passengers. Without KPI benchmarks, maintenance planning becomes reactive: PM tasks are missed, work orders pile up, technician time is unevenly distributed, and leadership cannot see whether fleet performance is improving. A strong fleet analytics scheduling framework connects maintenance schedules, work orders, inspections, vehicle uptime, technician capacity, parts availability, and compliance reporting into one measurable system. This guide explains the KPI benchmarks bus fleets should track in 2026 and how data-driven scheduling improves reliability, cost control, and operational planning.
Use scheduling analytics, KPI dashboards, work order trends, PM compliance, and technician capacity metrics to improve bus fleet reliability and planning.
Fleet scheduling affects every part of bus operations. If preventive maintenance is scheduled too late, breakdown risk increases. If buses are pulled from service at the wrong time, route coverage suffers. If technicians are overloaded on certain days, repair backlogs grow. If parts are unavailable during scheduled work, planned maintenance becomes downtime. Scheduling analytics helps managers see these problems before they become service failures.
The best fleets track scheduling as a performance system, not a static calendar. They measure whether PMs are completed on time, whether work orders are assigned to the right technicians, whether buses are available for dispatch, and whether repair capacity matches operational demand. These KPIs help managers make better decisions about staffing, parts purchasing, asset replacement, and compliance planning.
Not every metric deserves dashboard space. Fleet managers should focus on KPIs that connect directly to reliability, cost, compliance, and service availability. The strongest scheduling dashboards combine maintenance execution metrics, asset availability metrics, and technician capacity metrics.
A scheduling KPI dashboard should show what is healthy, what is slipping, and what needs management action. The dashboard should be simple enough for daily use but detailed enough to guide decisions. A weekly maintenance meeting can use these benchmarks to decide which buses to prioritize, which technicians need support, which parts should be reordered, and which PM tasks are at risk of becoming overdue.
Technician scheduling is one of the most overlooked areas of fleet analytics. Many fleets know which buses are due for service, but they do not know whether the shop has enough labor hours, bay space, and parts capacity to complete the work on time. Analytics solves this by showing labor demand by day, open work orders by priority, technician availability, bay utilization, and work order aging.
When maintenance supervisors can see technician capacity in advance, they can group similar work, reduce idle bay time, assign the right technician to the right job, and avoid pulling buses out of service when the shop cannot handle them. This reduces delayed repairs and improves vehicle availability.
Scheduling analytics only matters if it changes decisions. A strong workflow starts with data capture, then turns that data into planned work. Driver inspections, mileage updates, odometer readings, telematics alerts, technician notes, parts usage, and previous work orders should feed one scheduling engine. The system should then recommend PM tasks, flag overdue services, identify repeated defects, and show capacity conflicts before the schedule is finalized.
Inspections, mileage, work orders, downtime, parts, and technician notes.
Identify buses likely to miss service or generate breakdowns.
Match PM due dates with technician, bay, and parts availability.
Review KPIs weekly and adjust the next schedule cycle.
The best scheduling dashboards do not simply display numbers. They show where action is needed. Fleet managers should use analytics to balance PM timing, work order urgency, technician capacity, parts readiness, and fleet availability. When these signals are connected, scheduling becomes a reliability tool instead of an administrative task.
Fleet analytics scheduling helps bus fleet managers improve uptime, reduce emergency repairs, and make maintenance planning more predictable. Track PM compliance, schedule adherence, fleet availability, emergency work orders, repair cycle time, technician utilization, and parts stockouts. Review the dashboard weekly, connect defects to work orders, and use capacity data before finalizing the schedule. In 2026, high-performing fleets will not rely on spreadsheets and guesswork. They will use scheduling KPIs to plan maintenance before downtime happens.


