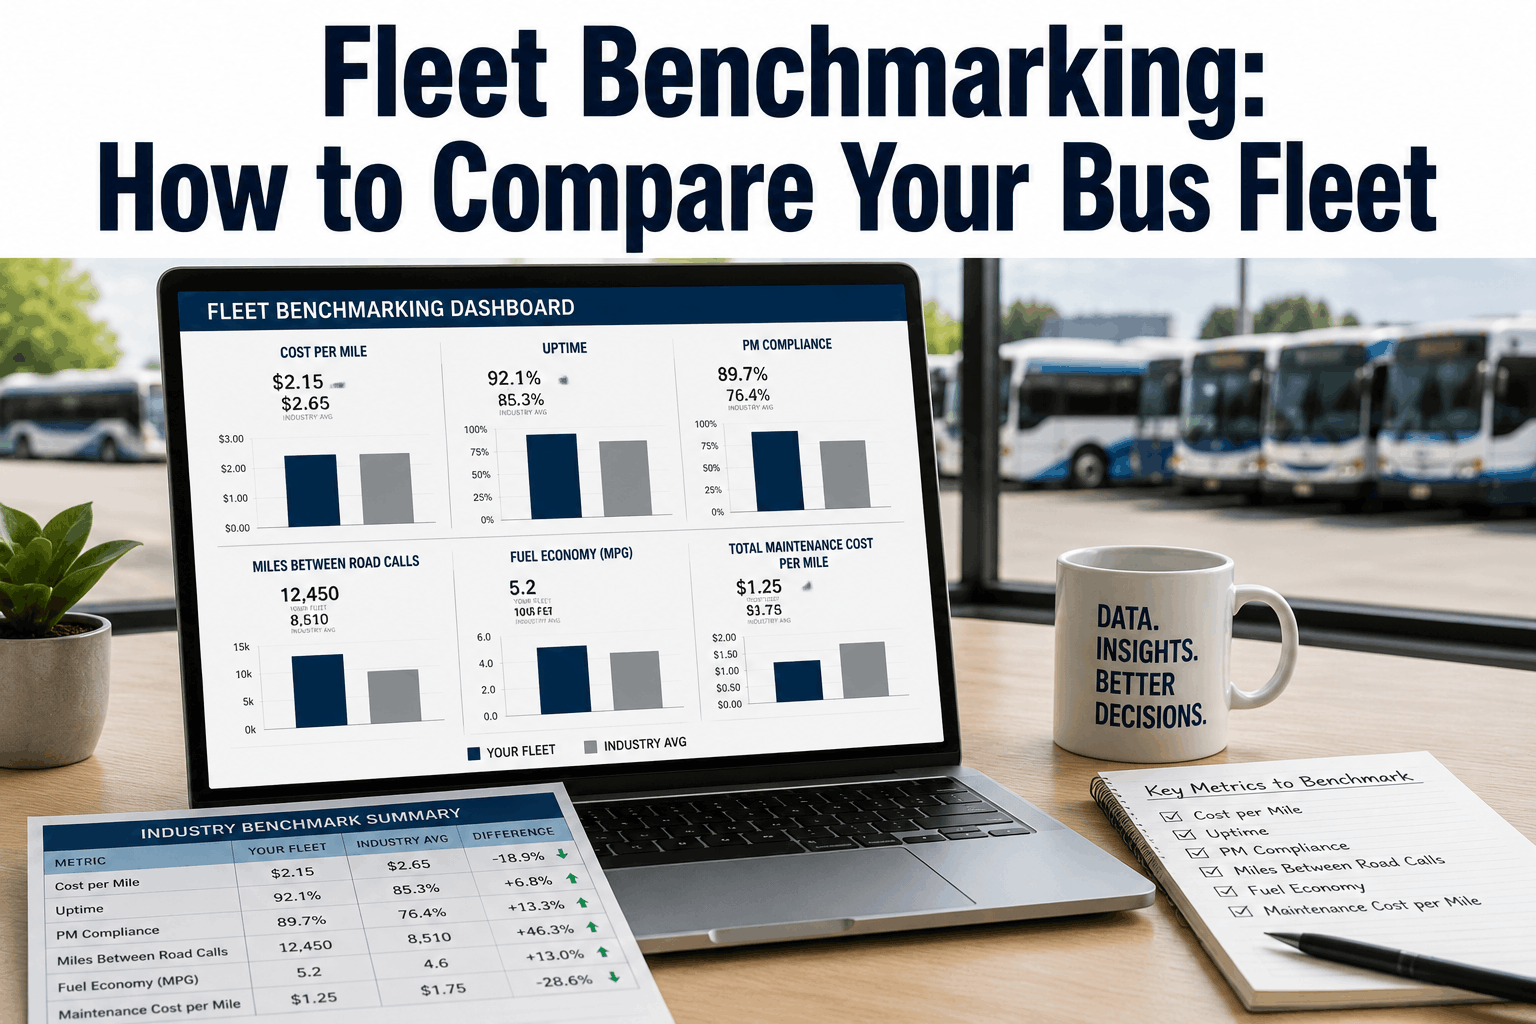
Most fleet operators don't know if their numbers are good or bad. They track cost per mile, uptime, and preventive maintenance compliance — but without industry benchmarks, those metrics are context-free. A transit authority in Kansas reported 94% uptime and felt confident until they benchmarked against peer fleets: the industry standard was 96.2%, and top performers were hitting 98%. They weren't failing. They were middle of the pack. That blindspot cost them. Fleet benchmarking transforms isolated metrics into strategic intelligence. When you know where you stand against comparable fleets, you can identify what's controllable, what's competitive, and what's broken. Here's how to benchmark your bus fleet against real data.
Fleet Benchmarking: How to Compare Your Bus Fleet
Are your numbers good or bad? Learn how to benchmark your bus fleet against industry data on cost per mile, uptime, and PM compliance.
Fleet operators track metrics obsessively — cost per mile, uptime, fuel economy, maintenance spend, driver turnover — but metrics in isolation tell you almost nothing. A cost per mile of $5.20 could be excellent for a rural fixed-route operation serving low-density areas, or it could be a significant drag on a city transit system with high-volume routes. Uptime of 95% is outstanding for a specialized transit fleet with aging equipment, and it's a liability for a premium coach service where customers expect near-perfect reliability. The difference isn't your competence. It's context. Industry benchmarking provides that context. When you map your metrics against comparable fleets — same size category, same operational model, same geography where feasible — you discover what's performance-driven versus what's structural. You identify gaps that are worth closing and metrics that are already top-tier. You stop chasing improvements in areas where you're already competitive. The gap between knowing your numbers and understanding your numbers is benchmarking.
Cost per mile is the single most-watched fleet metric because it touches every stakeholder — finance, operations, procurement, and the board. It's also the most misunderstood benchmark because CPM varies dramatically by fleet size, geography, labor market, and operational model. A small rural transit authority with tight labor supply cannot match the CPM of a large urban system with full-time workforce and standardized routes. A coach operator with premium service expectations runs a different cost structure than a municipal transit agency. Understanding these variables is critical to meaningful benchmarking. The benchmark isn't "what's the average?" — it's "what's the average for a fleet like mine?" Fleet size matters. Fleets with 50–100 buses average $5.10–$5.80 per mile. Fleets with 200–500 buses average $4.40–$4.90. Fleets with 500+ buses average $3.80–$4.50. The economies of scale are real. Labor markets matter. High-wage regions (California, Northeast) see CPM 30–40% higher than lower-wage regions. Geography matters. Urban systems with frequent stops have higher CPM than highway-oriented fleets. The question isn't "are we above or below the overall average?" — it's "are we above or below the average for fleets in our segment?" Once you know your segment benchmark, you can identify the gap drivers: fuel, labor, maintenance, or parts costs.
Uptime is a lagging indicator of maintenance discipline. A fleet reporting 93% uptime isn't necessarily well-managed — it may be managing breakdowns reactively and still achieving adequate availability. A fleet at 97% uptime likely has proactive maintenance, predictive alerting, and high PM compliance. The gap between them isn't luck. It's process. Industry data shows a clear correlation: fleets with PM compliance above 92% average uptime of 96%+. Fleets with PM compliance below 85% average 93% or lower. The relationship is direct. PM compliance is defined as the percentage of scheduled maintenance completed on or before the due date. A bus scheduled for a 50,000-mile service in month 6 and completed in month 7 still counts as compliant if your service interval tolerance is 10% (so due date is adjusted to month 7.6). Fleets tracking real-time due dates and completion against scheduled work orders achieve 95–100% compliance. Fleets with manual scheduling or loose tolerances see 80–88% compliance. The benchmark question isn't "are we doing maintenance?" — it's "are we completing scheduled maintenance on time?" Because that's what separates reliable fleets from everyone else.
Industry benchmarking data comes from multiple sources, each with different scope and reliability. Public transit agencies report metrics to the Federal Transit Administration (FTA) — extensive data but aggregated at system level, not fleet segment. Peer networks like the Transportation Research Board (TRB) compile fleet data from members — detailed but limited to participating agencies. Consulting firms publish benchmarking reports — broadly sampled but expensive. Software vendors accumulate data from customer fleets — large sample but vendor-specific methodologies. The quality of your benchmarking depends on finding data from fleets that match your segment: same size category, same operational model, same geography if possible. A 75-bus urban transit system should benchmark against other urban systems of 50–100 buses, not against 400-bus regional carriers or 25-bus rural shuttles. The benchmark isn't useful unless it's comparable. Key variables for segment matching: fleet size (50 buses vs 200 buses creates cost structure differences), operational model (fixed-route city transit vs on-demand paratransit vs coach service have completely different metrics), geography (labor costs, fuel costs, weather impact vary by region), and fleet age (average age affects maintenance spending and reliability). Once you identify peer fleets, the most reliable benchmarks come from: (1) Peer network data (transit agencies sharing metrics), (2) FTA reporting (public systems, free access), (3) Vendor-accumulated data (if you use the same platform as peers), (4) Industry associations (APTA, TRB, regional transit councils). Start with free sources. Only invest in paid consulting if you need granular analysis or proprietary segmentation.
Benchmarking is only useful if it drives decisions. Fleets that benchmark successfully follow a repeatable process: identify your segment, find comparable benchmark data, measure your metrics against benchmarks, identify gaps, and execute improvements. Here's the framework that works.
Fleet benchmarking isn't about winning a comparison — it's about understanding what's possible. When you know the median cost per mile for your fleet segment, the top-25% target, and the specific metrics that separate them, you have a roadmap. Most fleets don't benchmark because the process feels abstract. But it's practical: identify segment, pull data, measure your metrics, find the gap drivers, execute improvements. Fleets that move from reactive to proactive benchmarking typically improve CPM by 8–15%, uptime by 3–5%, and PM compliance by 10–18% within 12 months. BusCMMS tracks your core metrics automatically, shows real-time benchmarking against industry data, and surfaces the gaps you can close fastest.
Most fleet metrics in isolation are meaningless. A cost per mile of $5.20 could be excellent or terrible depending on your fleet size, location, and operational model. Uptime of 93% could be outstanding or underperforming relative to what's achievable. Fleet benchmarking fills that gap. When you measure your metrics against comparable fleets — same size, same model, same market — you discover what's controllable and what's competitive. You identify gaps where investments will have the highest impact. Most fleets are in the middle 50%. The difference between middle and top 25% is 8–15% lower cost per mile and 3–5% higher uptime. That gap is closable through PM discipline, predictive maintenance, and continuous benchmarking. BusCMMS tracks your core metrics, shows real-time comparisons against industry benchmarks, and highlights the highest-impact improvement opportunities.


