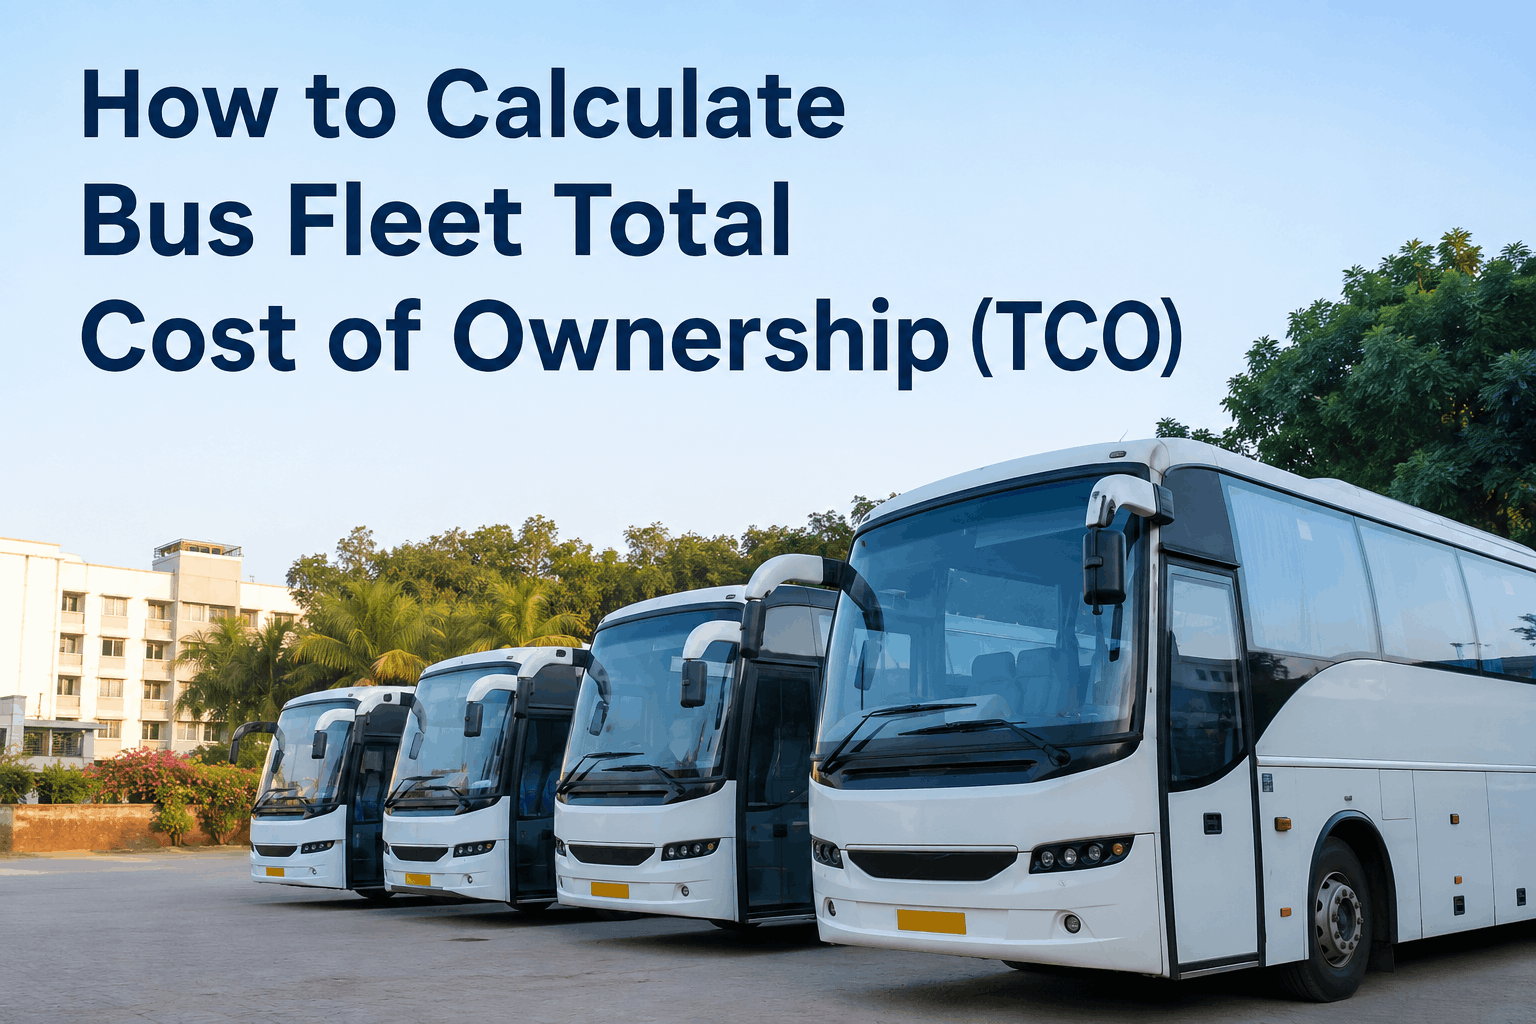
Total Cost of Ownership (TCO) is the most important financial metric for bus fleet operators. Understanding the true cost of a bus — acquisition, fuel, PM, repairs, downtime, depreciation, and residual value — helps you make better purchasing decisions, optimize maintenance spend, and plan for replacements. This guide provides a worked TCO model you can adapt for your fleet.
TCO Guide 2026
How to Calculate Bus Fleet Total Cost of Ownership (TCO)
Calculate bus fleet total cost of ownership properly. Acquisition, fuel, PM, repairs, downtime, depreciation, residual — worked TCO model.
TCO Impact: The Cost of Not Knowing
Fleets that don't track TCO overspend on purchasing, maintenance, and replacements. Understanding TCO helps you make data-driven decisions about bus acquisition, maintenance strategies, and replacement timing. TCO analysis can save 15-25% of lifecycle costs.
15-25%
Potential lifecycle savings
$500,000-$600,000
Average bus TCO over 15 years
7-10 years
Optimal replacement window
7
TCO cost categories
Seven Cost Categories of TCO
1. Acquisition Cost
Description: Purchase price, delivery fees, initial inspection, and upfitting. Typically 35-45% of TCO.
2. Fuel Cost
Description: Diesel, gasoline, or electricity costs over the vehicle's life. Typically 20-30% of TCO.
3. Preventive Maintenance
Description: Oil changes, filters, inspections, and scheduled maintenance. Typically 10-15% of TCO.
4. Repairs
Description: Unscheduled repairs, component replacements, and breakdown fixes. Typically 10-15% of TCO.
5. Downtime
Description: Lost revenue from buses out of service. Often overlooked but significant. Typically 5-10% of TCO.
6. Depreciation
Description: Loss in value over time. 15-20% annual decline. Typically 10-15% of TCO.
7. Residual Value
Description: Value at sale or trade-in. Reduces net TCO. Typically 5-15% of original cost.
TCO Cost Distribution by Category
Acquisition cost is the largest TCO component at 40%, followed by fuel at 25%. Preventive maintenance accounts for 12%, repairs for 10%, and downtime for 6%. Depreciation is 5% and residual value is 2%. Understanding this distribution helps prioritize cost reduction efforts.
TCO Calculation Worked Example
Step 1: Acquisition
Bus purchase: $450,000. Delivery and upfit: $50,000. Total acquisition: $500,000.
Step 2: Fuel
Annual mileage: 40,000. Fuel economy: 7 MPG. Diesel: $4.00/gallon. Annual fuel: $22,857. 15-year fuel: $342,855.
Step 3: PM & Repairs
PM: $4,000/year = $60,000 over 15 years. Repairs: $3,500/year = $52,500 over 15 years.
Step 4: Downtime
5 days/year at $1,200/day = $6,000/year. $90,000 over 15 years.
Step 5: Depreciation
Purchase: $500,000. Residual: $75,000. Depreciation: $425,000 over 15 years. $28,333/year.
Step 6: Total TCO
Acquisition $500,000 + Fuel $342,855 + PM $60,000 + Repairs $52,500 + Downtime $90,000 - Residual $75,000 = $970,355. Annual TCO: $64,690. Cost per mile: $4.04.
TCO Comparison by Bus Type
School bus TCO averages $820,000 over 15 years. Transit bus TCO averages $970,000. Motorcoach TCO averages $1.05 million. Electric bus TCO averages $890,000 — higher upfront but lower fuel and maintenance costs.
TCO Calculation Requirements
Data Collection
Collect acquisition cost, fuel consumption, maintenance records, repair costs, downtime data, and vehicle age. Use CMMS and fuel cards for accurate data.
Cost Allocation
Allocate all costs to individual vehicles. Include overhead, administration, and indirect costs. Be comprehensive to get true TCO.
Time Horizon
Use a 10-15 year time horizon for buses. Consider optimal replacement timing based on TCO. Adjust for expected life and usage patterns.
Discount Rate
Apply discount rate to future costs. Use your organization's cost of capital. Compare alternative scenarios.
Residual Value
Estimate realistic residual value at end of life. Consider market conditions, bus condition, and age. Residual reduces net TCO.
Scenario Analysis
Run multiple scenarios: different mileage, fuel prices, and maintenance costs. Identify cost drivers and mitigation strategies.
TCO Trends
Diesel TCO has increased from $680,000 to $970,000 over seven years due to rising fuel and maintenance costs. Electric TCO has decreased from $950,000 to $890,000 as battery costs decline and technology improves. By 2026, electric buses will reach TCO parity with diesel in many applications.
TCO KPIs
Track these five metrics to measure your TCO program effectiveness:
Cost Per Mile
Target: Decreasing or stable trend. Track quarterly. This is the ultimate TCO measure.
Cost Per Revenue Hour
Target: Decreasing or stable trend. Track quarterly. Measures operating efficiency.
Maintenance Cost Per Mile
Target: Decreasing or stable trend. Track quarterly. Measures maintenance efficiency.
Fuel Cost Per Mile
Target: Decreasing or stable trend. Track quarterly. Fuel is the largest variable cost.
Vehicle Lifecycle Cost
Target: At or below industry average. Track annually. Measures total fleet efficiency.
Our transit agency implemented comprehensive TCO tracking in 2024. We discovered that our actual maintenance costs were 28% higher than we thought. By analyzing TCO data, we optimized PM intervals, reduced fuel waste, and extended vehicle life. Annual fleet savings exceeded $1.2 million.
Track Your TCO with BusCMMS
BusCMMS provides the data you need to calculate and track TCO — acquisition costs, fuel consumption, maintenance records, repair costs, downtime tracking, and depreciation data. Book a demo to see how BusCMMS helps fleets optimize total cost of ownership.
Fleet TCO FAQs
How do I calculate bus fleet TCO?
Calculate TCO by summing acquisition cost, fuel cost, PM cost, repair cost, downtime cost, and depreciation, then subtracting residual value. Use a 10-15 year time horizon. Apply discount rate for future costs. Track all costs accurately for each vehicle.
What is a typical bus TCO?
Typical bus TCO over 15 years: school bus $820,000, transit bus $970,000, motorcoach $1.05 million, electric bus $890,000. Annual TCO ranges from $55,000-$70,000 per bus. Cost per mile ranges from $3.50-$4.50.
How can I reduce bus TCO?
Reduce TCO by: optimizing fuel economy, implementing PM discipline, reducing repairs through quality maintenance, minimizing downtime, extending vehicle life, and improving driver behavior. Every 1% TCO reduction saves $5,000-$7,000 per bus.
What is the optimal bus replacement age?
Optimal replacement age is typically 7-10 years for transit buses, 10-12 years for school buses, and 8-10 years for motorcoaches. TCO analysis helps determine the optimal point where operating costs exceed replacement costs.
How does electric bus TCO compare to diesel?
Electric bus TCO is approaching parity with diesel. Electric buses have lower fuel and maintenance costs but higher acquisition costs. TCO parity is expected by 2026-2027. Electric buses already have lower TCO in high-mileage, heavy-duty applications.
The Bottom Line
Total Cost of Ownership is the most important financial metric for bus fleet operators. Understanding the seven cost categories — acquisition, fuel, PM, repairs, downtime, depreciation, and residual value — helps you make data-driven decisions about purchasing, maintenance, and replacement. The TCO calculation model provides a framework for estimating costs over a 15-year life cycle. Acquisition and fuel represent over 60% of TCO, making them the top priorities for cost reduction. Typical TCO ranges from $820,000 for school buses to $1.05 million for motorcoaches. Electric bus TCO is decreasing and approaching parity with diesel. When combined with proper CMMS tracking, TCO analysis transforms fleet financial management — identifying cost drivers, optimizing maintenance spend, and improving capital planning decisions.


