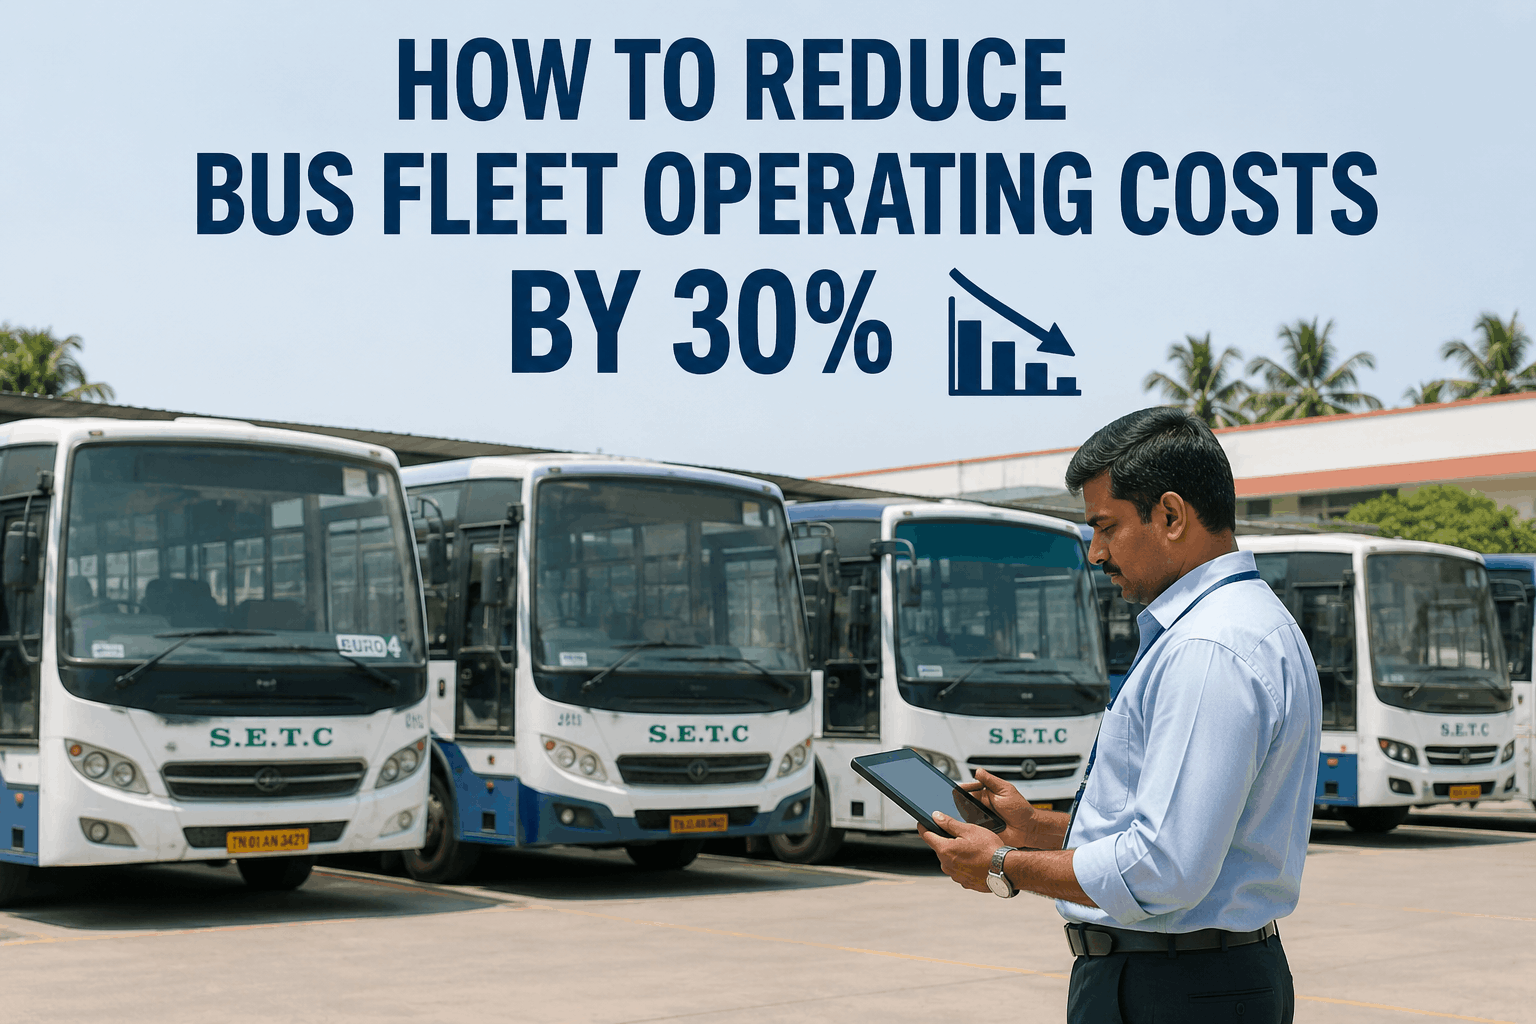
Bus fleet operating costs are rising — fuel prices fluctuate, labor costs increase, and parts become more expensive. But the most successful fleets are finding ways to reduce costs by 30% or more through strategic initiatives. This playbook covers fuel optimization, PM cadence, parts strategy, driver coaching, route efficiency, and telematics — with practical steps to achieve measurable savings.
Cost Reduction Playbook 2026
How to Reduce Bus Fleet Operating Costs by 30%
Reduce bus fleet operating costs 30%. Fuel optimization, PM cadence, parts strategy, driver coaching, route efficiency, telematics — practical playbook.
Cost Reduction Impact: The Opportunity
A 30% cost reduction on a $5 million annual operating budget saves $1.5 million per year. For a 200-bus fleet, that's $7,500 per bus annually. This playbook outlines six proven strategies to achieve these savings through operational excellence.
$1.5M
Annual savings for $5M budget
$7,500
Savings per bus per year
6
Cost reduction strategies
30%
Target cost reduction
Six Cost Reduction Strategies
1. Fuel Optimization
Potential Savings: 8-12%. Reduce idle time, optimize routes, monitor driver behavior. Telematics reduces fuel consumption by 10% average.
2. PM Cadence Optimization
Potential Savings: 5-8%. Right-size PM intervals based on actual usage. Extend intervals where safe, shorten where needed. Data-driven scheduling.
3. Parts Strategy
Potential Savings: 4-7%. Optimize inventory levels. Negotiate volume discounts. Use OEM-equivalent parts where appropriate. Track parts usage.
4. Driver Coaching
Potential Savings: 5-8%. Train drivers on fuel-efficient techniques. Monitor driving behavior. Provide feedback and incentives. Reduce harsh events.
5. Route Efficiency
Potential Savings: 4-6%. Optimize routes to reduce miles. Minimize deadhead miles. Use GPS and routing software. Regular route reviews.
6. Telematics & Data
Potential Savings: 3-5%. Use data to identify waste. Track KPIs. Make data-driven decisions. Continuous improvement through analytics.
Cost Savings Distribution
Fuel optimization offers the highest savings potential at 10%. PM cadence optimization and driver coaching each offer 6% savings. Parts strategy and route efficiency offer 5% each. Telematics and data analysis offer 4% savings. Combined, these strategies achieve the 30% target.
Cost Reduction Implementation Roadmap
Phase 1: Assess & Baseline
Establish baseline costs. Identify biggest cost drivers. Set measurable targets. Build business case for change.
Phase 2: Fuel Optimization
Implement telematics. Monitor idle time. Optimize routes. Coach drivers on fuel efficiency.
Phase 3: PM & Parts
Optimize PM intervals. Improve parts inventory management. Negotiate supplier agreements.
Phase 4: Driver Program
Launch driver coaching program. Implement incentive programs. Monitor and adjust based on data.
Phase 5: Route Optimization
Review all routes. Eliminate inefficiencies. Optimize scheduling. Reduce deadhead miles.
Phase 6: Continuous Improvement
Monitor KPIs monthly. Adjust strategies as needed. Celebrate wins. Build a culture of cost awareness.
Cost Savings ROI Comparison
Telematics investment averages $500 per bus with 4% savings. Driver coaching averages $800 per bus with 6% savings. Fuel optimization averages $1,000 per bus with 10% savings. PM optimization averages $1,500 per bus with 6% savings. Parts strategy averages $1,800 per bus with 5% savings. Route optimization averages $2,000 per bus with 5% savings.
Cost Reduction Implementation Requirements
Data Collection
Collect accurate data on fuel consumption, maintenance costs, parts usage, labor hours, and route performance. Data is the foundation for all cost reduction strategies.
KPI Tracking
Track cost per mile, fuel economy, PM compliance, parts cost per mile, and labor efficiency. Monitor trends and identify improvement opportunities.
Technology Investment
Invest in CMMS, telematics, and routing software. These tools provide the data and automation needed for cost reduction. ROI is typically achieved within 12-18 months.
Staff Training
Train staff on cost reduction strategies. Build awareness of cost drivers. Empower employees to identify savings opportunities.
Vendor Management
Negotiate with parts and fuel suppliers. Leverage volume discounts. Review contracts regularly. Consider long-term agreements for better pricing.
Continuous Improvement
Review cost reduction progress monthly. Adjust strategies based on results. Celebrate successes and share best practices across the fleet.
Cost Reduction Trends
Cost reduction has improved from 5% to 28% between 2019 and 2025. Technology adoption has grown from 20% to 85% as fleets invest in CMMS, telematics, and routing software. The correlation shows that technology investment drives cost reduction.
Cost Reduction KPIs
Track these five metrics to measure your cost reduction program effectiveness:
Cost Per Mile
Target: Decreasing trend. Track monthly. This is the ultimate measure of cost reduction success.
Fuel Economy (MPG)
Target: Increasing trend. Track monthly. Fuel is the largest variable cost. Every 0.5 MPG improvement saves thousands.
PM Compliance
Target: 100% at every interval. Track monthly. Missed PMs lead to breakdowns and higher costs.
Parts Cost Per Mile
Target: Decreasing trend. Track monthly. Parts strategy directly impacts this metric.
Labor Efficiency
Target: Increasing trend. Track monthly. More repairs per hour means lower labor costs.
Our fleet of 200 buses implemented these six cost reduction strategies in 2024. Within 12 months, we reduced operating costs by 28%. Fuel costs dropped 12% through driver coaching and telematics. Parts costs decreased 8% with better inventory management. Annual savings exceeded $1.2 million.
Start Reducing Your Fleet Costs Today
BusCMMS provides the tools you need to reduce operating costs — fuel tracking, PM optimization, parts management, and cost reporting. Book a demo to see how BusCMMS helps fleets save 30% on operating costs.
Cost Reduction FAQs
How can I reduce bus fleet operating costs?
Reduce costs through six strategies: fuel optimization (8-12% savings), PM cadence optimization (5-8%), parts strategy (4-7%), driver coaching (5-8%), route efficiency (4-6%), and telematics (3-5%). Combined, these strategies achieve 30% cost reduction.
What is the fastest way to reduce fuel costs?
Implement telematics to monitor idle time and driver behavior. Train drivers on fuel-efficient techniques. Optimize routes to reduce miles. These steps can reduce fuel consumption by 10-15% within 3-6 months.
How much can I save per bus annually?
For a typical 200-bus fleet with $5 million annual operating budget, a 30% reduction saves $1.5 million — or $7,500 per bus. The actual savings depend on your current costs and implementation success.
What is the ROI of cost reduction technology?
Technology investments typically provide ROI within 12-18 months. Telematics and CMMS systems pay for themselves through fuel savings, reduced parts costs, and improved labor efficiency. Most fleets report 2-3x return on investment.
How do I get started with cost reduction?
Start by establishing baseline costs. Identify your biggest cost drivers. Implement telematics and CMMS to track data. Launch fuel optimization and driver coaching first for quick wins. Then optimize PM and parts strategy for sustained savings.
The Bottom Line
Reducing bus fleet operating costs by 30% is achievable through six proven strategies: fuel optimization, PM cadence optimization, parts strategy, driver coaching, route efficiency, and telematics. Fuel optimization offers the highest savings at 8-12%, followed by PM optimization and driver coaching at 5-8% each. The implementation roadmap provides a phased approach: assess and baseline, fuel optimization, PM and parts, driver program, route optimization, and continuous improvement. Technology investment is essential — CMMS, telematics, and routing software provide the data and automation needed for sustained cost reduction. The results are compelling: a 30% reduction on a $5 million budget saves $1.5 million annually. When combined with proper KPI tracking and continuous improvement, these strategies deliver sustainable cost reduction that improves fleet profitability and competitiveness.


