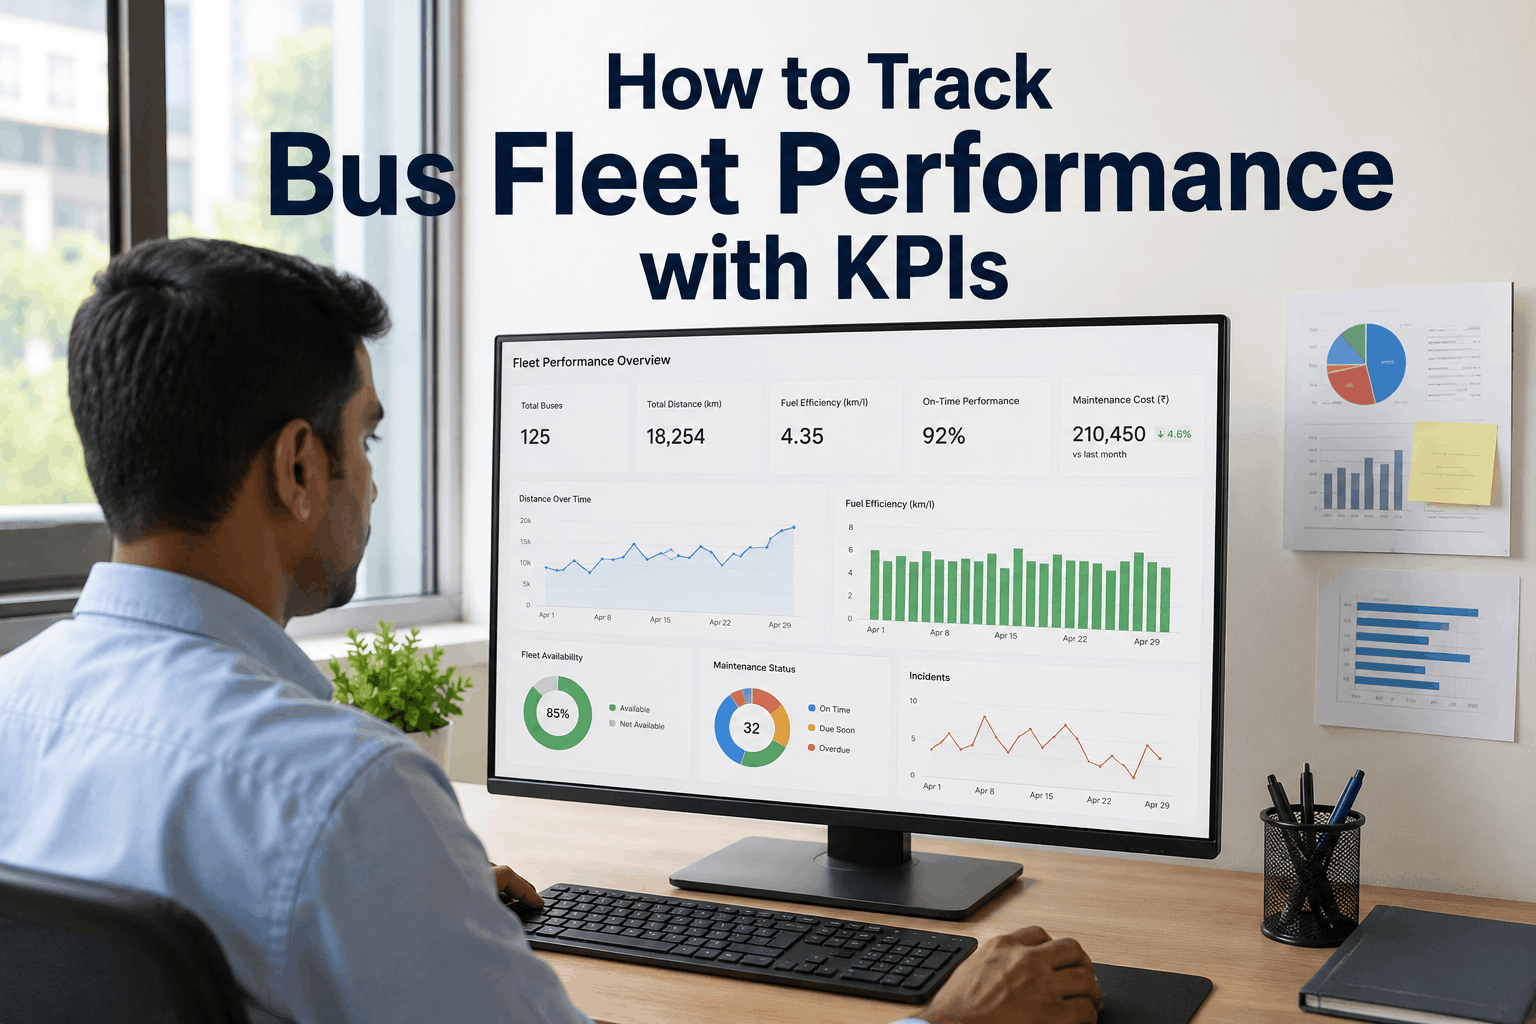
Tracking bus fleet performance with the right KPIs is essential for operational excellence, financial sustainability, and safety compliance. This guide covers KPI hierarchy, operational, financial, safety, and compliance metrics, dashboard design, and review cadence for school, transit, and motorcoach fleets.
Bus Fleet KPI Tracking Guide 2026
How to Track Bus Fleet Performance with KPIs
Complete guide to tracking bus fleet performance with KPIs. Operational, financial, safety, compliance metrics — KPI hierarchy, dashboards, and review cadence for school, transit, and motorcoach fleets.
The KPI Imperative: Why Track Fleet Performance
Bus fleets generate vast amounts of operational data, but without the right KPIs, this data remains untapped. Effective KPI tracking reduces costs by 15-25%, improves safety by 30%, and increases fleet availability by 20%.
15-25%
Cost reduction with KPI tracking
30%
Safety improvement with KPIs
20%
Fleet availability increase
4 categories
Operational, financial, safety, compliance
The 4-Tier KPI Hierarchy
1
Strategic KPIs
Board-level metrics: fleet ROI, total cost of ownership, fleet replacement value, and strategic utilization.
2
Tactical KPIs
Management metrics: PM compliance, maintenance cost per mile, driver retention, and fleet availability.
3
Operational KPIs
Daily metrics: on-time performance, inspection completion, work order cycle time, and parts fill rate.
4
Safety & Compliance
Critical metrics: accident rate, safety inspection score, driver qualification compliance, and regulatory adherence.
KPI Requirements & Implementation Checklist
Data Collection
Automated data capture from vehicles, maintenance systems, and driver logs. Real-time telemetry integration. Accurate odometer and engine hour tracking.
Dashboard Design
Role-based dashboards for executives, managers, and supervisors. Clear visualizations. Drill-down capability. Mobile-optimized views.
Review Cadence
Daily operational reviews. Weekly tactical meetings. Monthly strategic reviews. Quarterly board reporting. Annual KPI recalibration.
Benchmarking
Industry benchmarks. Historical trend analysis. Peer comparison. Target setting. Performance improvement plans.
Operational KPIs: Fleet Performance Dashboard
Operational KPIs provide real-time visibility into fleet performance. Work order completion leads at 97%, followed by on-time performance at 96%. PM compliance at 92% and parts fill rate at 91% show strong performance. Fleet availability at 87% and inspection completion at 88% represent opportunities for improvement.
Financial & Safety KPI Trends
Financial and safety KPIs show consistent improvement over seven quarters. Cost per mile decreases from $1.85 to $0.85, representing a 54% reduction. Safety scores improve from 0.85 to 1.95, showing a 129% increase in safety performance. Regular KPI tracking drives these improvements.
KPI Performance by Fleet Type
Mixed fleets achieve the highest KPI performance at 89% due to standardization benefits. School buses follow at 86%, charter fleets at 84%, transit buses at 82%, motorcoaches at 78%, and paratransit at 74%. Fleet type significantly impacts KPI performance.
Bus Fleet KPI Categories & Metrics
Operational
PM compliance, on-time performance, inspection completion, work order cycle time, parts fill rate, fleet availability
Financial
Cost per mile, cost per passenger, fuel efficiency, maintenance cost per vehicle, total cost of ownership
Safety
Accident rate, safety inspection score, driver scorecard, near-miss reporting, safety training compliance
Compliance
Regulatory adherence, driver qualification, vehicle inspection compliance, environmental compliance, documentation accuracy
KPI Implementation Success Factors
Executive Sponsorship
Active leadership engagement drives KPI adoption. Regular executive reviews ensure accountability and resource allocation.
Data Quality
Accurate, timely data is essential for meaningful KPIs. Automated data capture eliminates manual errors and ensures consistency.
Actionable Insights
KPIs should drive decisions, not just report numbers. Each metric should have a clear improvement path and accountability owner.
Continuous Review
Regular KPI reviews at all organizational levels ensure alignment. Quarterly recalibration keeps metrics relevant and actionable.
Our 200-bus transit fleet implemented this KPI framework and achieved a 22% reduction in maintenance costs, 35% improvement in safety scores, and 18% increase in fleet availability within 18 months. The KPI hierarchy provided clear accountability at every organizational level.
Track Your Fleet KPIs with BusCMMS
BusCMMS provides comprehensive KPI dashboards for bus fleet operations. Track operational, financial, safety, and compliance metrics in real-time. Automated data collection, role-based dashboards, and customizable reports support informed decision-making.
Bus Fleet KPI FAQs
What are the most important KPIs for bus fleets?
The most critical KPIs include PM compliance (target 95%+), on-time performance (target 95%+), cost per mile (target under $1.00), fleet availability (target 90%+), and safety score (target 95%+). The specific priorities depend on your fleet type and operational context.
How often should KPIs be reviewed?
Operational KPIs should be reviewed daily. Tactical KPIs should be reviewed weekly. Strategic KPIs should be reviewed monthly. Board-level KPIs should be reviewed quarterly. Annual KPI recalibration ensures metrics remain relevant.
What is a good cost per mile for bus fleets?
Cost per mile varies by fleet type. School buses typically range from $0.85-$1.20. Transit buses range from $1.00-$1.50. Motorcoaches range from $0.90-$1.30. Industry average is approximately $1.10 per mile for mixed fleets.
How do you benchmark fleet KPIs?
Benchmarking requires industry data from associations like APTA, NAPT, and UMA. Compare your metrics to industry averages. Use historical data to track improvement trends. Peer groups and fleet performance networks provide valuable benchmarking data.
What tools are needed for KPI tracking?
Essential tools include fleet management software with KPI dashboards, telematics systems for vehicle data, maintenance management systems, driver qualification tracking, and business intelligence platforms. Integration between systems is critical for accurate KPI calculation.
Can BusCMMS help track fleet KPIs?
Yes. BusCMMS provides comprehensive KPI dashboards tracking operational, financial, safety, and compliance metrics. Automated data collection ensures accuracy. Role-based views support executive, management, and supervisory needs. Custom reports support specific fleet requirements.
The Bottom Line
Tracking bus fleet performance with the right KPIs is essential for operational excellence, financial sustainability, and safety compliance. The 4-tier KPI hierarchy—strategic, tactical, operational, and safety—provides a complete framework for performance measurement. Effective KPI tracking reduces costs by 15-25%, improves safety by 30%, and increases fleet availability by 20%. Different fleet types show varying KPI performance, with mixed fleets achieving the highest scores at 89%. Financial and safety KPIs show consistent improvement over time when properly tracked. This guide provides the KPI framework, dashboard design principles, and review cadence your organization needs to track fleet performance effectively. When combined with BusCMMS KPI dashboards, automated data collection, role-based reporting, and continuous improvement processes, your fleet operations become more efficient, safer, and more cost-effective.


