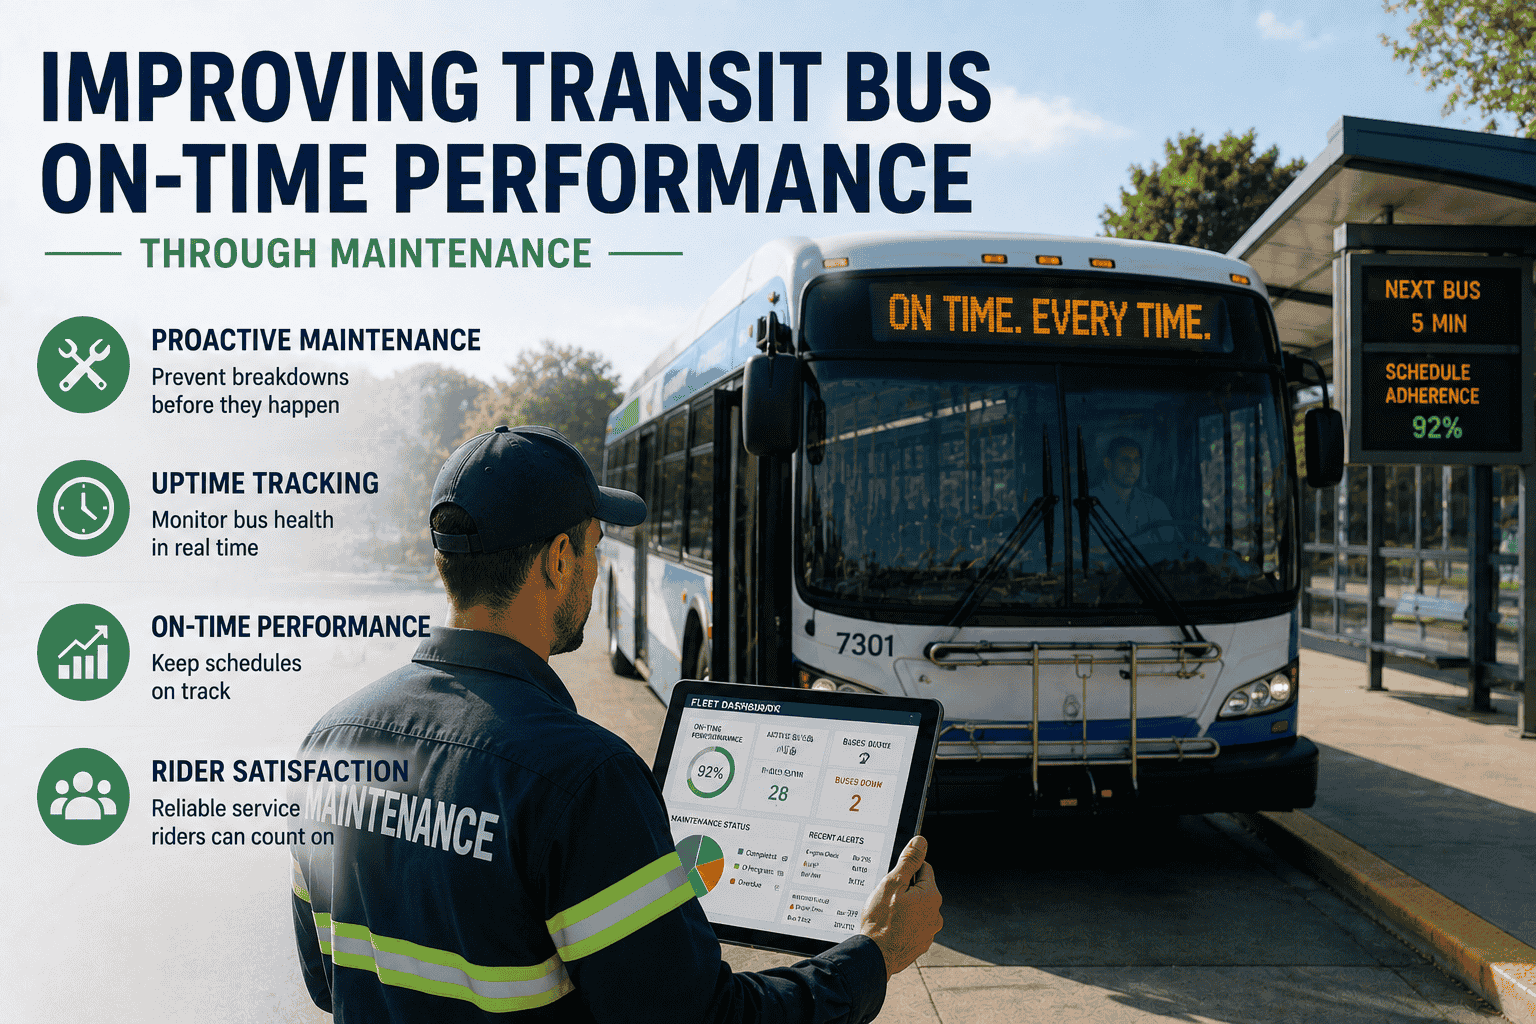
On-time performance (OTP) is the metric riders care most about. If your bus is supposed to arrive at 8:15 AM, arriving at 8:30 AM is a missed connection or a late arrival at work. Chronic lateness damages ridership and revenue. Most transit agencies track OTP as a KPI (90%+ is considered good performance). The common assumption: OTP is about driver behavior and route design. In reality, 30–40% of late arrivals are caused by vehicle maintenance issues. A bus with a failing transmission runs rough, loses power, runs late. A bus with overheating engine slows traffic. Brake problems extend stopping times. A bus that breaks down mid-route causes cascading delays. Here's the data-driven truth: agencies with high PM compliance (95%+) consistently achieve 90%+ OTP. Those with low PM compliance (70%–80%) struggle to hit 85% OTP. The connection is direct. This guide explains how.
Improving Transit Bus On-Time Performance Through Maintenance
Breakdowns wreck schedules. See how proactive maintenance and uptime tracking improve transit on-time performance and rider satisfaction.
Vehicle maintenance affects OTP in three ways: (1) Complete failures. A transmission fails mid-route. The bus stops, driver calls dispatch. Replacement bus arrives (15–30 min wait). Passengers transferred. Route is now 30–45 minutes behind. Cascading delays hit downstream routes that rely on this bus. (2) Performance degradation. A transmission is failing but still operational. The bus runs slow, loses power on hills, slips under load. A 30-minute route takes 40 minutes. The driver is now 10 minutes late to the next scheduled trip. This ripples. (3) Subtle issues. Worn brake pads increase stopping distance. Overheating engine causes driver to slow to cool it. Loose suspension causes rough ride, slowing driver. Individually, each adds 1–3 minutes of delay. Collectively, a bus with multiple minor issues might be 10–15 minutes late by end of shift. In a transit agency with 200 buses, if 20 buses have maintenance issues (10% of fleet), and each adds 10 minutes of average daily delay, that's 200 minutes of daily system-wide delay. Over a year, that's over 1000 hours of delays. Riders notice. Ridership declines. Revenue declines. Agencies that proactively maintain achieve predictable performance and protect revenue.
A CMMS configured for OTP excellence tracks: (1) Vehicle availability. Which buses are operational vs. down for maintenance. (2) Work order completion time. How fast can the shop turn around repairs. (3) Mean time between failures (MTBF). How often do buses fail. High MTBF = reliable buses. Low MTBF = frequent failures. (4) Defect trends. Which systems are failing (transmission, brakes, electrical). (5) PM compliance per bus. Which buses are getting scheduled services (and which are slipping). With this data, agencies can: (1) Identify problem buses early. A bus with low MTBF or high defect count is flagged for detailed inspection. Small repairs made proactively prevent large failures. (2) Schedule maintenance during off-peak hours. If you know Bus 14 needs a transmission service, schedule it at night, not during peak service hours. (3) Balance workload. If the shop is backed up, prioritize maintenance on buses with high defect counts, lowest MTBF. (4) Plan spares strategically. Knowing which buses are most likely to fail allows scheduling of spares in advance. The result: fewer mid-route failures, better OTP, happier riders.
The connection between maintenance and OTP is often overlooked. Most agencies blame late arrivals on traffic, driver behavior, or scheduling. But 30–40% of delays are actually mechanical. A CMMS that tracks vehicle reliability, defects, and PM compliance gives agencies visibility into this root cause. With visibility comes action. Agencies improve PM compliance, reduce vehicle failures, improve OTP, and see measurable improvements in ridership and revenue.
On-time performance is directly tied to vehicle reliability. Agencies with high PM compliance and proactive maintenance achieve 90%+ OTP. Those without consistent maintenance struggle at 80–85% OTP. The solution is not driver training or route optimization (though those matter). The solution is making sure buses are mechanically sound. CMMS enables this by tracking vehicle health, defects, and PM compliance in real-time.


