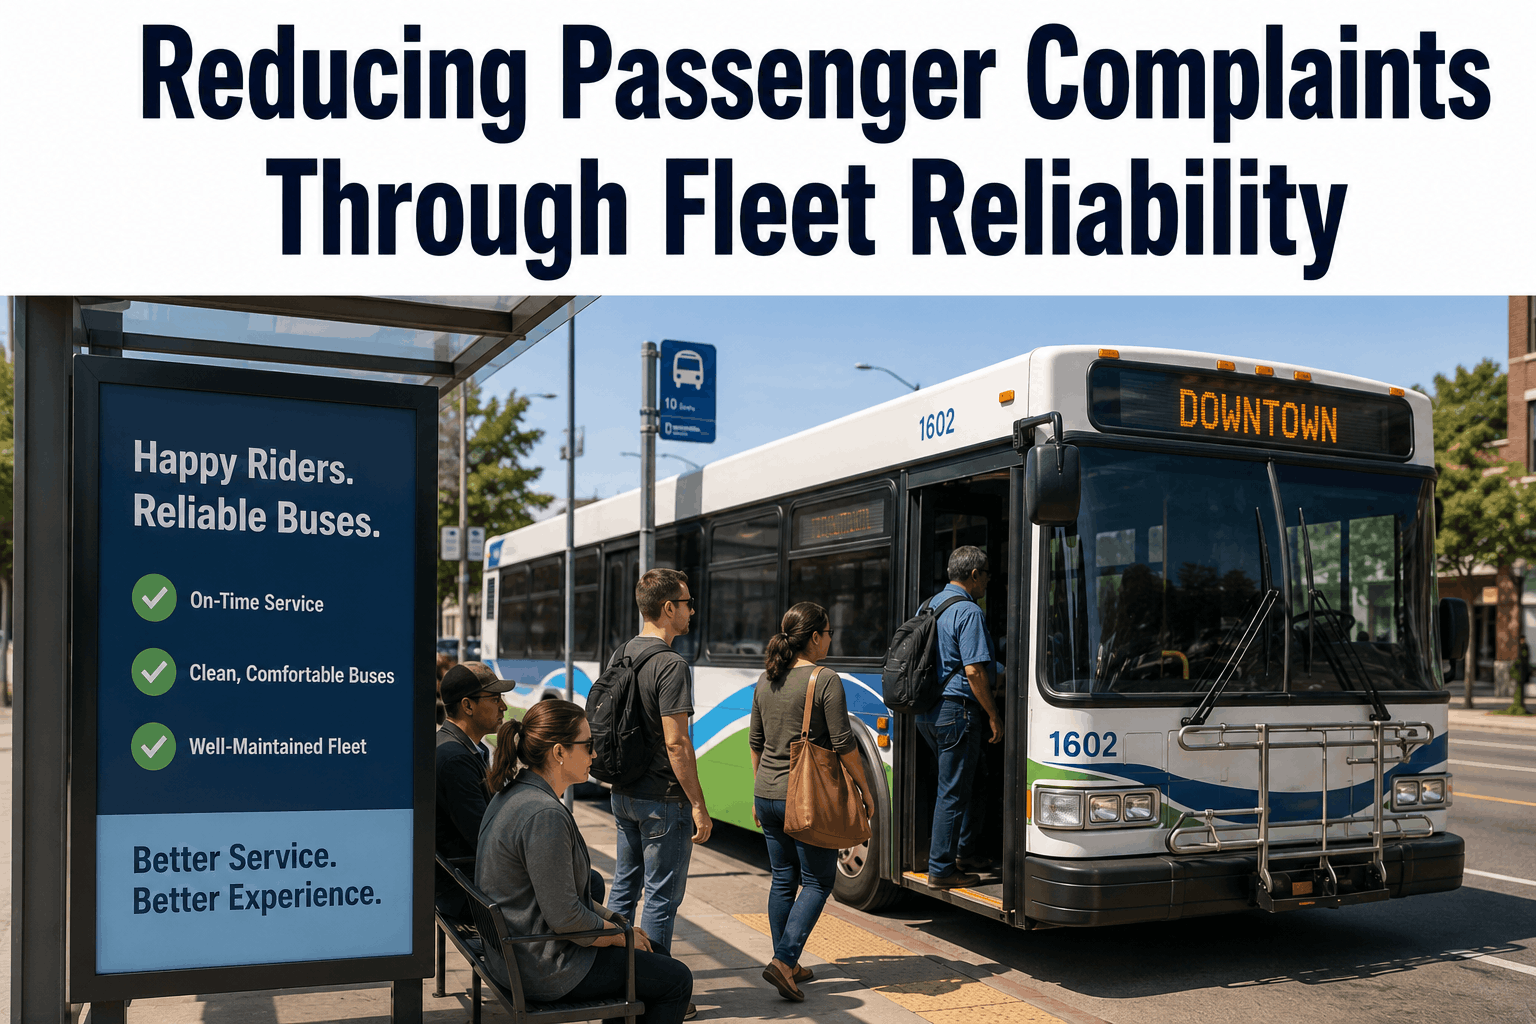
Reducing Passenger Complaints Through Fleet Reliability
A regional transit authority in Colorado tracked every passenger complaint for 18 months. When they mapped complaints against vehicle maintenance records, the pattern was unmistakable: 71% of all rider complaints came from just 14% of the fleet — the buses with the most deferred maintenance. Complaints about late arrivals, rough rides, and uncomfortable cabins weren't random. They were predictable. And they were preventable. Passenger satisfaction is a maintenance problem as much as a service design problem. Breakdowns cause delays. Failing HVAC causes discomfort. Worn suspensions cause rough rides. Dirty air filters cause cabin odor. Every one of these has a maintenance fix. Here's what the data shows.
Passenger Experience 2026
Reducing Passenger Complaints Through Fleet Reliability
Breakdowns cause delays. HVAC failures cause discomfort. Deferred maintenance drives complaints. Here's how reliability maintenance lifts rider satisfaction.
Fleet Reliability & Passenger Complaints — Real Data
Top complaint category (transit)Late / delayed service
% complaints from bottom 15% of fleet60–75% of all complaints
HVAC-related comfort complaints2nd most common category
Complaint reduction (proactive PM)35–55% in 12 months
On-time rate impact (planned vs reactive)+18–28% improvement
Passenger complaints follow the maintenance curve. Fix the bottom of your fleet first.
01The Maintenance-Complaint Link: What the Data Shows
Passenger complaint data is a lagging indicator of maintenance failures. By the time a rider submits a complaint about a rough ride, a broken seat, or a late bus, the underlying maintenance issue has existed for days or weeks. The connection is direct and measurable. A bus with a failing air compressor produces brakes that engage unevenly — riders feel lurching stops and file "rough driving" complaints. A bus with a clogged cabin air filter develops odors at high idle — riders file "dirty bus" complaints. A bus with a marginal starter motor causes service delays — riders file "late bus" complaints. The fleets that track complaints by vehicle number and cross-reference against maintenance records discover that complaint reduction is fundamentally a maintenance scheduling problem. Identify the highest-complaint vehicles. Pull their maintenance history. The deferred items and the complaints will align.
Complaint Source by Maintenance Status (Typical Fleet)
Well-maintained (top 40%)
12% of complaints
Average maintenance
25% of complaints
Deferred PM (bottom 15%)
63% of all complaints
Targeting maintenance resources at the bottom 15% of your fleet often produces a 50%+ reduction in total complaints.
Complaints Mapped to Root Causes
"Bus was late"Roadside breakdown, slow start, marginal battery/starter, brake drag
"Too hot / too cold"HVAC refrigerant loss, blocked condenser, failed blower motor, clogged filter
02HVAC Maintenance: The #1 Comfort Complaint Driver
HVAC system failures generate more passenger complaints per incident than any other single maintenance category in bus fleets. A bus without working air conditioning in July generates 15–30 complaints per route. A bus with inadequate heat in February generates similar volumes. Yet HVAC failures are among the most preventable through disciplined seasonal maintenance. The protocol used by low-complaint fleets: spring HVAC service before first hot weather operation — refrigerant level check, condenser coil cleaning (road grime cuts airflow by 30–50%), blower motor current draw check, thermostat calibration, and cabin filter replacement. Fall service before first cold: heat exchanger inspection, defrost system test, blend door actuator function check. Year-round: cabin air filter replacement every 15,000–20,000 miles. This annual program costs $400–$600 per bus. One summer season of passenger complaints from a failed system costs far more in customer service, reputation, and contract risk.
HVAC Annual Service Schedule — Low-Complaint Fleets
03On-Time Performance: Maintenance Is the Hidden Variable
Transit operators track on-time performance (OTP) obsessively — and typically attribute poor numbers to traffic, scheduling, and driver behavior. Maintenance's role is systematically underestimated. Roadside breakdowns are obvious: a bus that goes out of service mid-route delays every passenger on it plus every passenger waiting on the next three runs. But subtler mechanical issues also degrade OTP. A bus with a marginal starter motor takes an extra 45–90 seconds to start at each layover — enough to cause cascading lateness on a tight schedule. A bus with air system leaks takes longer to build brake pressure before departure, adding 2–4 minutes to terminal dwell. Tire pressure imbalance increases rolling resistance, slowing hill climbs by measurable amounts on route segments. The fleets that surgically improve OTP don't just optimize schedules — they pull the maintenance records on their chronically late buses and fix what's actually slowing them down.
Predictive alerts pull at-risk buses before route assignment
Tire pressure checks weekly — rolling resistance maintained
Result: 18–28% OTP improvement in first 12 months
"We were hitting 81% on-time performance and couldn't figure out why. Traffic analysis showed nothing. Then we pulled maintenance records for our 12 worst-performing buses by route. Nine of them had deferred air system work. Fixed those, added starter testing to pre-season PM. We're at 91% OTP now. The schedule didn't change. The buses did."
— Operations Director, 62-bus municipal transit authority, Colorado
04Driver Defect Reports: The Complaint Early Warning System
The most underused tool for reducing passenger complaints is the driver Vehicle Inspection Report (VIR). Drivers experience everything passengers will experience — rough rides, heating issues, unusual noises, sluggish starts — hours before the first passenger boards. Fleets with low complaint rates treat VIR submissions as a complaint prevention system. Every defect report triggers a work order. Work orders get resolved before the bus returns to service. The gap in most fleets isn't driver reporting — it's the process after the report. Defect reports that sit in a binder, get logged in a spreadsheet no one checks, or result in work orders that don't get prioritized are functionally useless. The standard for low-complaint fleets: any driver-reported comfort defect (HVAC, ride quality, odor, noise) resolved before next dispatch. Any safety defect resolved before next movement. Driver reports acknowledged within 2 hours so drivers keep submitting them.
If drivers stop submitting defect reports, your complaints will spike within 30–60 days. Unacknowledged reports = drivers assume nothing gets fixed = they stop reporting.
VIR Process — High-Performing Fleets
Report submissionDigital VIR at end of shift — comfort + safety categories separated
AcknowledgmentDriver gets confirmation within 2 hours. Builds trust, sustains reporting.
Work order creationAuto-generated from defect report. No manual transcription, no gaps.
Resolution SLAComfort defects: before next dispatch. Safety: before next movement.
Defect Categories That Drive Complaints
HVAC not performingHighest passenger impact. Any AC or heat issue = same-day resolution.
Unusual noisesSqueaks, rattles, brake grinding — passengers notice before mechanics
Ride qualityRoughness, pulling, vibration — suspension or tire issue. Inspect same day.
OdorsExhaust, burning, mildew — investigate source. Cabin filter often culprit.
05Building a Reliability Program That Reduces Complaints
The fleets with the lowest complaint rates share one characteristic: they treat passenger experience as a maintenance outcome, not just a service design problem. Here's the complete framework.
Complaint Reduction Through Maintenance — Action Framework
Week 1
Map last 90 days of complaints by bus number. Identify bottom 15%.
Week 2
Pull maintenance records on high-complaint buses. Find deferred items.
Week 3–4
Complete deferred maintenance on high-complaint vehicles. HVAC, suspension, brakes.
Ongoing PM
Add cabin air filter, HVAC seasonal service, and suspension to standard PM schedule.
Driver VIR
Digitize reports. Auto-generate work orders. Acknowledge within 2 hours.
Monthly review
Track complaints per vehicle. Any bus with 3+ complaints/month = maintenance review.
90-day target
Expect 30–50% complaint reduction with consistent execution of above.
Fleet Expert Review
Passenger complaints are a maintenance metric. The fleets with the lowest complaint rates aren't running more customer service training or complaint management software — they're fixing their buses. The connection between HVAC service, suspension condition, brake smoothness, and rider satisfaction is direct and quantifiable. Fleets that map complaints to vehicle records, address the bottom 15% of their fleet aggressively, and build digital driver defect reporting with immediate work order generation see 35–55% complaint reductions within 90 days. BusCMMS tracks complaints by vehicle, links them to maintenance records, and auto-generates work orders from driver defect reports — making the complaint-to-fix loop automatic.
The Bottom Line
Passenger complaints follow the maintenance curve. 60–75% of all rider complaints come from the bottom 15% of poorly maintained buses. HVAC failures drive comfort complaints. Deferred brake and suspension work drives ride quality complaints. Marginal starters and air system leaks drive on-time complaints. Every complaint category has a corresponding maintenance item. Fleets that map their complaints to vehicle maintenance records and aggressively address deferred work on their worst buses see 35–55% complaint reductions within 90 days — without changing routes, schedules, or hiring a single customer service representative. BusCMMS links complaint data to maintenance records, surfaces high-complaint vehicles automatically, and closes the loop from driver defect report to resolved work order.
BusCMMS links passenger complaints to vehicle maintenance records, surfaces high-complaint buses automatically, and closes the loop from driver defect report to resolved work order. Free 14-day trial.
What are the most common passenger complaints in bus fleets?
Late or delayed service is the most common complaint category, followed by HVAC comfort issues (too hot or too cold), rough ride quality, and odors or cleanliness. All four categories have direct maintenance causes: mechanical reliability, HVAC service, suspension condition, and cabin air filter replacement respectively.
How much can proactive maintenance reduce passenger complaints?
Fleets that systematically address deferred maintenance on their highest-complaint vehicles report 35–55% complaint reductions within 90 days. The key is mapping complaints to vehicle records, identifying the bottom 15% of the fleet by complaint volume, and completing deferred maintenance items on those buses first.
How often should bus HVAC systems be serviced?
Twice annually: spring service before the AC season (refrigerant check, condenser cleaning, blower test, cabin filter replacement) and fall service before the heating season (heat exchanger inspection, defrost system test, blend door check). Cabin air filters should be replaced every 15,000–20,000 miles regardless of season.
How do driver defect reports reduce passenger complaints?
Drivers experience every mechanical problem before passengers do. Digitized driver defect reports that automatically generate work orders create a direct pipeline from driver observation to maintenance resolution — before the first passenger boards. Fleets with acknowledged, acted-upon VIR systems see significant reductions in complaints that previously went unresolved for days.
What maintenance items have the most impact on on-time performance?
Starter motor condition, air system integrity (leaks cause extended pre-departure brake buildup time), and tire pressure have the most direct impact on OTP beyond obvious breakdown prevention. A bus with air system leaks can add 2–4 minutes to each terminal dwell — enough to cause cascading lateness across an entire schedule.
Can BusCMMS track passenger complaints by vehicle?
Yes. BusCMMS allows complaint logging by bus number, cross-references complaint history with maintenance records, and surfaces vehicles that consistently generate complaints alongside their deferred maintenance items. Driver defect reports auto-generate work orders, closing the loop from report to resolution automatically.
Complaints. Maintenance. Reliability. One Dashboard.
Link rider complaints to vehicle records. Surface your highest-complaint buses. Auto-generate work orders from driver reports. All in BusCMMS. Free 14-day trial.