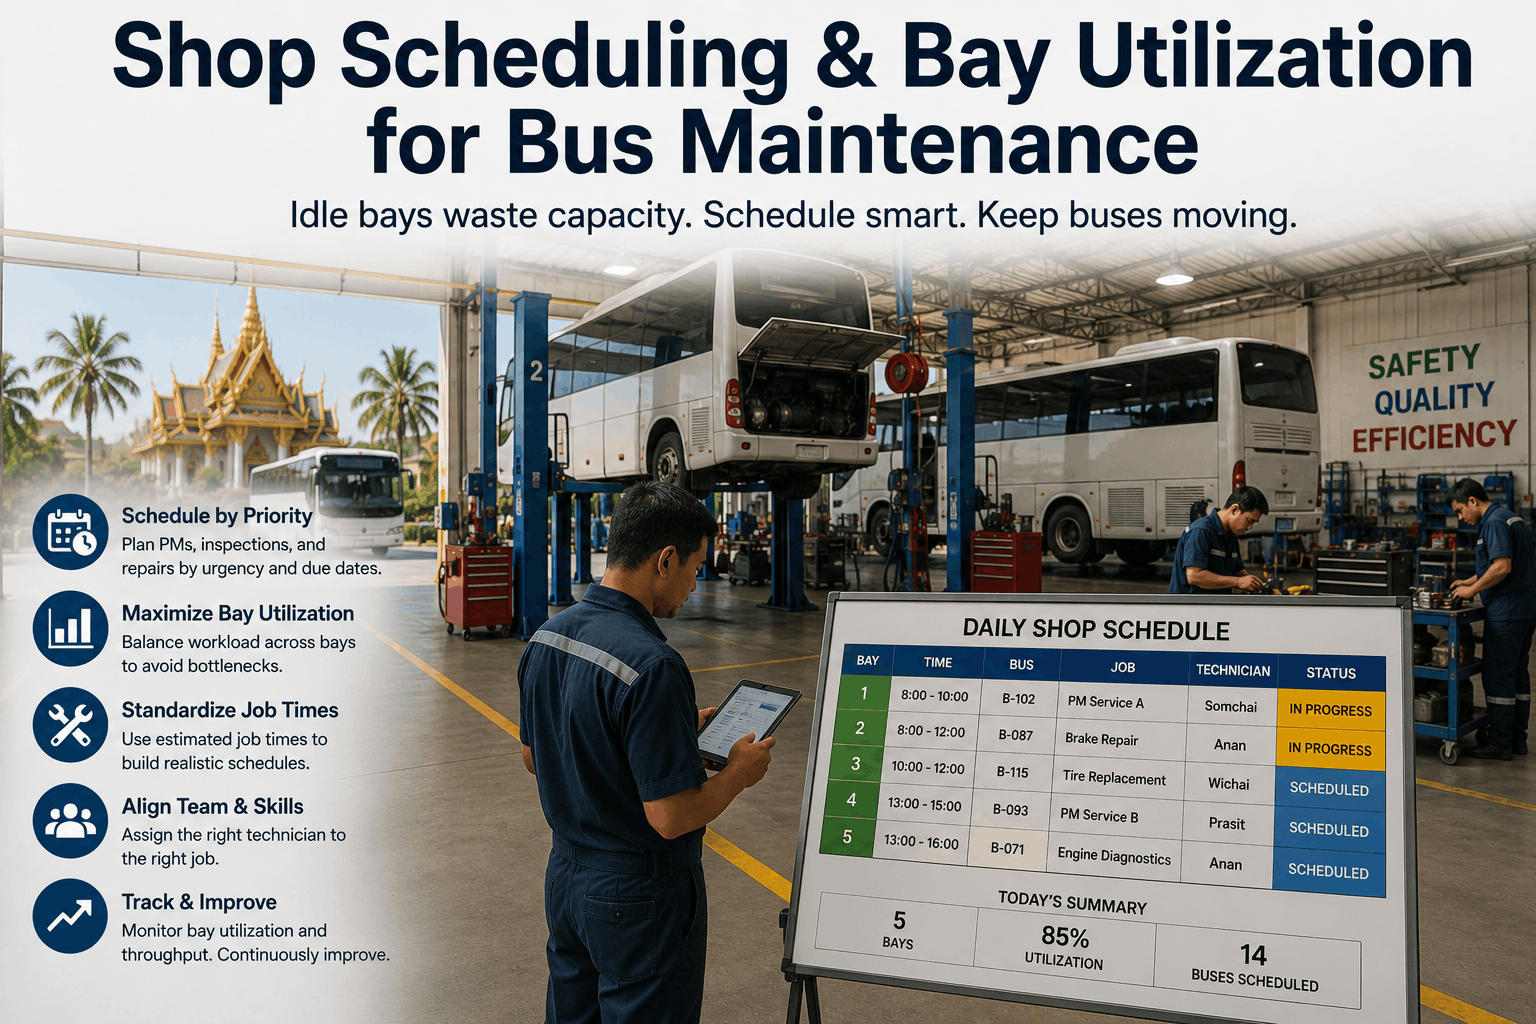
A 50-bus fleet had 6 maintenance bays. On paper, that should handle 50 buses. In reality, one bay was always blocked (waiting for parts), one was being cleaned, one had a bus that needed a second day of work, and one mechanic was on vacation. Three bays worked that day. A 50-bus fleet with 3 working bays can service maybe 10-12 buses per week (assuming 2-3 hour average service time per bus). Over a year, that's 520-624 buses serviced. But you have 50 buses × 52 weeks = demand for 2,600 bus-services per year (if each bus needs one service per week). You're 76% short. The math doesn't work. Most fleets don't calculate this. They just notice the maintenance queue is always full and assume they need more mechanics. Wrong. The problem is shop scheduling — how you allocate bay time and mechanic time. A fleet optimized for shop scheduling can service twice as many buses with the same bays and labor. This guide shows how to calculate bay utilization, identify where time is wasted, and restructure the shop to move more buses through without adding capacity.
Most fleets leave 40-50% of bay capacity unused. Not because they lack bays — because they lack scheduling discipline. Here's how to reclaim it.
You can't optimize what you don't measure. Start by calculating true bay utilization: (Total productive bay-hours ÷ Total available bay-hours) × 100. Example: 6 bays, 10 hours per day, 250 working days per year = 15,000 available bay-hours per year. If you logged 6,000 productive bay-hours (actual maintenance work), your utilization is 40%. That's typical. Most fleets operate at 35-55% utilization and think it's normal. It's not. It's a symptom of poor scheduling. Now measure the waste: Where do the missing 9,000 bay-hours go? (1) Waiting for parts: 2,500 hours (17% of capacity). Bus sits in bay waiting for replacement alternator that won't arrive for 3 days. (2) Scheduling gaps: 1,500 hours (10%). Bus is scheduled for maintenance, but the mechanic is on vacation. Bay sits empty. (3) Setup/cleanup: 2,000 hours (13%). Cleaning bay between services, organizing tools, paperwork. (4) Idle time: 2,000 hours (13%). Buses waiting to be brought into bays, staff breaks, lunch, transition time. Total waste: 8,000 bay-hours (53% of capacity). That's your opportunity. You can't reclaim all of it (some setup and cleanup is necessary). But you can reclaim 40-60% of the waste (3,200-4,800 bay-hours). That's an 21-32% increase in capacity.
The single biggest waste category is parts waiting. A bus sits in a bay waiting for a replacement alternator. Mechanic sits idle. Bay can't serve another bus. This kills utilization. Solution: critical parts inventory. Most fleets don't stock spare parts — they order on demand. Order-to-arrival takes 3-7 days. During that time, the bus is either in a bay (waste) or outside the bay (creates scheduling chaos). Create a parts inventory for high-failure, long-lead-time components. Examples: alternators, starters, water pumps, brake calipers, fuel pumps, transmission fluid (bulk), oil (bulk), brake fluid (bulk), air filters, fuel filters, cabin filters, belts, hoses, thermostats. Cost to stock these items: ~$15,000 one-time investment for a 50-bus fleet. Storage: a 6ft × 8ft closet and some shelving. Inventory management: a simple spreadsheet or CMMS module (bin count, reorder point, lead-time). ROI: a single prevented parts-wait downtime event (3-day delay, lost revenue $5,000-10,000) breaks even. Most fleets prevent 2-3 parts-wait events per year. Payback: 2-4 months. The capital investment in parts inventory is cheap compared to the bay utilization cost of waiting.
The second waste category is scheduling gaps. Bus is supposed to arrive Monday but doesn't show until Wednesday. Mechanic waits. Bay sits empty. The cure: a 2-week rolling schedule. Every Monday, you finalize the maintenance schedule for that week and the following week (14 days). Each day has a bay assignment for each scheduled bus. No changes after Monday (except emergencies). Example: Week 1: Bay 1 gets buses 01, 06, 11. Bay 2 gets buses 03, 08, 12. Etc. Week 2: Same pattern, different buses. Both weeks are fixed. Mechanics know exactly which buses they're working on each day. Parts are pre-positioned for that week (you know you need 2 alternators for Monday's jobs). Buses are scheduled to arrive at their appointed bay time. No idle mechanics. No "what are we doing today?" questions. The schedule is the law. Emergencies (breakdown, accident damage) take a separate bay and schedule. But your PM work follows the master schedule. A proper master schedule reduces scheduling gaps from 1,500 hours to <300 hours. That's 80% waste elimination in this category.
Setup/cleanup eats 2,000 bay-hours (13% of capacity). This includes: cleaning the bay before/after a bus, organizing tools, moving buses in/out, paperwork, waiting for inspectors (if applicable). Some is necessary (safety, hygiene). Some is waste. Example of waste: thorough bay cleaning between every single service (takes 30 minutes). Example of efficiency: dedicated cleaning crew that cleans bays during lunch/break (same labor, no bay downtime). Another: tool setup. If each mechanic organizes their own tools (10 minutes per service), that's 50 minutes lost per 5 services. Use a tool cart system where all tools are pre-staged per job. Another: paperwork. If mechanics fill out service cards by hand (5 minutes per service), move to digital work orders on tablets (30 seconds). Reducing setup/cleanup from 2,000 to 1,000 hours (50% reduction) is realistic. You eliminate another 1,000 bay-hours of waste. That's 7% more capacity.
Even with perfect scheduling and inventory, some weeks are peaks (month-end PM rush, post-inspection surge). Instead of adding permanent mechanics (expensive, underutilized in slow weeks), use temporary labor. Contract mechanics or retired mechanics can handle overflow. Cost: $80-100/hour vs $50-60/hour for permanent (total loaded cost). But you use them 2-3 weeks per year, not 52 weeks. For those peak weeks, extra labor prevents costly bus downtime and speeds throughput. A 50-bus fleet might add 1-2 temporary mechanics for 3-4 weeks per year. Cost: ~$8,000-12,000/year. Benefit: zero peak backlog, faster throughput, happier operations team. That's a trade most fleets are willing to make. The point: utilization optimization isn't just about bays — it's about labor flexibility. Permanent mechanics are fixed cost. Temporary mechanics are variable cost. Use both strategically.
Most fleet directors think the problem is "we don't have enough bays or mechanics." Usually, the real problem is "we're wasting 50% of the bays we have." A typical fleet operates at 40% bay utilization. Best-in-class fleets operate at 70-75%. The gap is 30-35 percentage points. For a 50-bus fleet with 6 bays, that's 4,500-5,250 additional bay-hours per year. Translate that to service capacity: 15-20 more buses per week. For many fleets, that solves the entire maintenance backlog without adding a single bay. The solution isn't capital — it's discipline. Parts inventory ($15K investment), 2-week scheduling (free, requires discipline), setup/cleanup optimization (low cost), and temporary labor for peaks ($8-12K/year). Total investment: ~$25K. Benefit: 90% capacity increase. No expansion, no new construction, no hiring permanent staff.
A 50-bus fleet with 6 maintenance bays running at 40% utilization is typical. It's also broken. The fleet can't keep up with maintenance demand because bays are idle, not because capacity is insufficient. Reclaim utilization by: (1) stocking critical parts ($15K investment, eliminates 2,500 hours of waiting). (2) Implementing 2-week rolling schedule (eliminates 1,200 hours of scheduling gaps). (3) Minimizing setup/cleanup (eliminates 1,000 hours). (4) Surge capacity with temporary labor (handles peaks without permanent overhead). Total: move from 40% to 75% utilization without adding bays. That's 9,000 additional bay-hours per year — enough to service 20+ more buses per week. For a fleet with a maintenance backlog, this is the fastest, cheapest path to relief.


