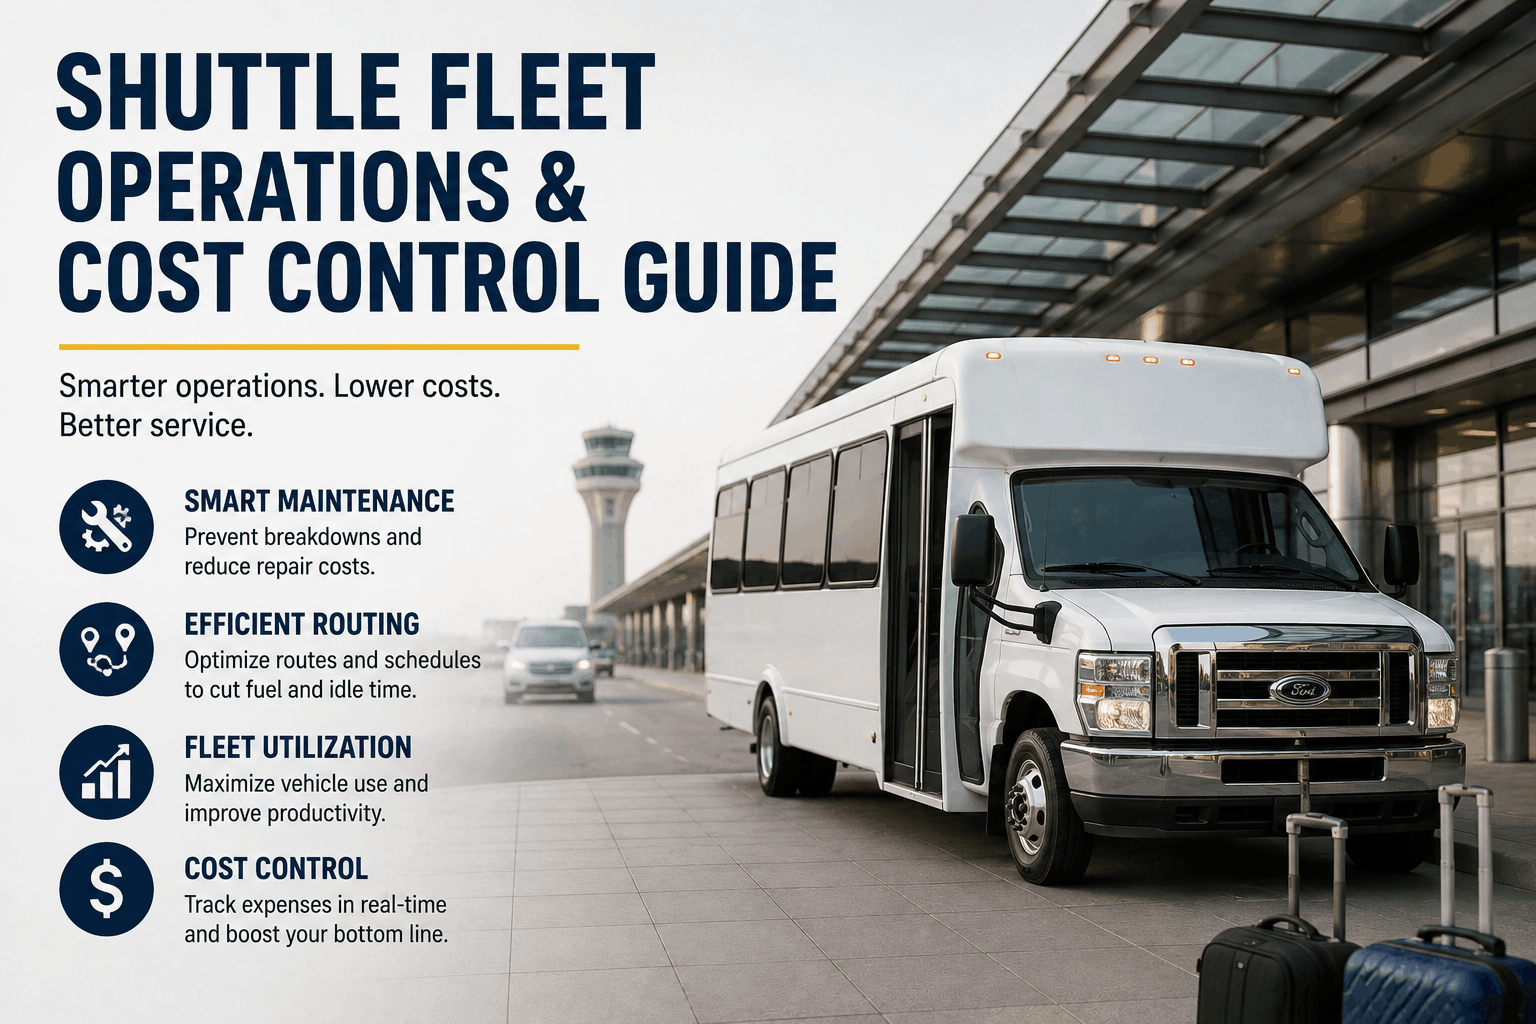
Shuttle Fleet Operations & Cost Control Guide


shuttle-fleet-operations-cost-control

A hotel shuttle operation runs 12 buses. The economics are brutal: thin margins, irregular demand, and fixed costs (parking, insurance, maintenance, dispatch) that don't fluctuate with occupancy. A bus running one hotel shuttle to the airport costs almost the same as a bus running five shuttles. The difference between profit and loss on a 12-bus hotel fleet is often whether the operation runs at 60% or 75% vehicle utilization. A shuttle operator who doesn't control costs aggressively goes out of business. A shuttle operator who does — understands vehicle routing, knows which routes are profitable and which are deadweight, maintains buses preventively (not reactively), trains drivers on fuel efficiency, and optimizes scheduling — builds sustainable margins. The best shuttle operators aren't the ones with the newest buses. They're the ones who squeeze 30% more productivity out of the same asset base. On a $1.5M revenue shuttle fleet, a 30% productivity gain is $450,000 additional profit. That's not growth. That's operational discipline. Every shuttle fleet can capture this, but only if they manage cost systematically instead of reacting to each crisis as it emerges.

Shuttle Operations 2026
Shuttle Fleet Operations & Cost Control

Tight margins demand tight operations. Master cost control and you build sustainable profitability.

12-Bus Hotel Shuttle Fleet Economics
Annual revenue (avg $125/trip, 40 trips/day)$1,825,000365 days operation
Operating cost (avg)$1,350,00074% of revenue
Gross margin (avg)$475,00026% before corporate overhead
Margin variation (efficiency)18–35%Depends on cost control practices
Same fleet, same routes, 17% difference in margin based on operational discipline.
01The Shuttle Economics Model: Why Margins Are Thin

Shuttle fleets operate on fixed-cost models that don't scale. A 12-bus hotel shuttle fleet has fixed costs regardless of occupancy: facilities (parking, dispatch center), insurance, registration, and staff (dispatcher, maintenance supervisor) are paid whether buses run full or half-empty. Variable costs (fuel, driver wages, maintenance) scale with utilization but not proportionally — a bus running 50% full costs almost as much to operate as one running 80% full. The result: shuttle economics are sensitive to utilization rate. A fleet at 60% utilization might operate at 22% margin. The same fleet at 75% utilization operates at 32% margin. The difference isn't route pricing (hard to raise in competitive markets). It's operational efficiency: fewer deadhead miles (empty repositioning), better scheduling (minimize idle time), predictive maintenance (prevent breakdowns), and driver training (fuel efficiency). A 15-point utilization swing generates 10+ points of margin improvement. For a $1.8M revenue fleet, that's $180,000 in additional profit from the same buses, same routes, same market. The challenge: shuttle operators often don't measure or manage utilization. They optimize by anecdote and crisis response, not data.

Annual Cost Structure: 12-Bus Shuttle Fleet
Labor (drivers, dispatcher, supervisor)
$540,000
40% of costs
6 drivers @ $45k + benefits, dispatcher, maintenance supervisor
Fuel
$324,000
24% of costs
12 buses × 60k miles/year @ 6.5 MPG, $3.00/gallon
Maintenance & repairs
$216,000
16% of costs
PM, parts, tires, brakes, fluids. $18k per bus annually
Insurance & registration
$135,000
10% of costs
Commercial liability, vehicle insurance, registration fees
Facilities & dispatch
$108,000
8% of costs
Parking lot, dispatch office, phone systems, dispatch software
Other (uniforms, training, cleaning)
$27,000
2% of costs
Driver uniforms, annual training, bus cleaning supplies
Total Operating Cost
$1,350,000
Revenue: $1,825,000 | Margin: $475,000 (26%)
02Utilization Optimization: The Highest-Impact Lever

Shuttle utilization is measured as vehicle-revenue-hours (VRH): the number of hours buses spend in revenue service. A bus that operates one 4-hour airport shuttle contributes 4 VRH. A bus that operates two shuttles (outbound and return, each 3 hours) contributes 6 VRH. The difference is deadhead miles: the return trip repositioning the bus. A shuttle operator who minimizes deadhead (by batching pickups, using smaller vehicles for low-demand times, and optimizing routes) increases VRH without adding buses. A 12-bus fleet at 60% utilization averages 5.76 VRH per bus per day (14.4 operating hours daily ÷ 12 buses = 1.2 hrs/bus, but accounting for overlap, roughly 5.76 VRH average). The same fleet at 75% utilization increases to 7.2 VRH per bus per day. For a hotel with consistent demand, this is often achievable through: (1) dynamic routing (combining multiple hotel guests into single shuttles), (2) time-windowed scheduling (batch pickups rather than on-demand), (3) sub-fleet specialization (one 30-seat bus for high-demand times, one 15-seat minibus for off-peak), and (4) integration with hotel operations (coordinate checkout times with shuttle departure).

Utilization Optimization: Daily Schedule Impact
Current Schedule (60% Utilization)
6:00–9:00 AM 6 buses out Airport outbound (3 trips, 3 buses + 3 bus return deadhead)
9:00–12:00 PM 2 buses out Scattered guest transfers (light demand)
12:00–3:00 PM 1 bus out Minimal demand (off-peak)
3:00–6:00 PM 8 buses out Airport inbound + hotel returns (return deadhead heavy)
Daily VRH: 69.12 hours / 12 buses = 5.76 hrs per bus (60% utilization)
Optimized Schedule (75% Utilization)
6:00–9:00 AM 4 buses + 1 minibus Airport outbound batched (fewer return deadheads, smaller bus on low volume)
9:00–12:00 PM 2 buses out + 1 minibus Batch guest transfers + airport returns (route optimization reduces trips)
12:00–3:00 PM 2 buses out Mid-day shuttles + off-peak demand batched into one route
3:00–6:00 PM 6 buses + 1 minibus Airport inbound optimized (batched pickups, minibus for overflow)
Daily VRH: 86.4 hours / 12 buses = 7.2 hrs per bus (75% utilization) | Result: +17.2 VRH/day = $2,064/day additional revenue
03Preventive Maintenance: The Cost Control Foundation

Shuttle buses run tight schedules. A breakdown during morning airport rush cascades: guests miss flights, the hotel receives complaints, reputation damage compounds. A shuttle operator who runs reactive maintenance (fix when broken) is constantly firefighting. A shuttle operator who runs preventive maintenance (replace before failure) eliminates crises. The cost difference is counterintuitive: preventive is cheaper. A brake pad replacement done on schedule costs $1,200. A brake system failure during service costs $12,000 (emergency towing, liability, missed revenue, customer recovery). A transmission fluid change on schedule costs $400. A transmission failure costs $8,000+. Across a year, a 12-bus shuttle fleet running preventive maintenance typically spends $18k–22k per bus annually (routine PM, oil changes, tire rotations, brake inspections). A fleet running reactive maintenance often spends $26k–32k per bus (emergency repairs, catastrophic failures, downtime). The preventive fleet also has zero unplanned breakdowns. The reactive fleet has 3–5 per year. For a fleet earning thin 26% margins, eliminating downtime breakdowns is the difference between profit and loss.

Preventive Maintenance: 12-Bus Annual Cost Comparison
Preventive Maintenance Approach
Oil & filter changes (every 15k miles) $6,000 4–5 changes per bus per year
Tire rotation & replacement $4,200 Rotate every service, replace at tread depth
Brake inspections & pad replacement $3,600 Quarterly inspections, replace at 2mm tread
Coolant flushes & belt replacements $2,400 Scheduled per OEM intervals
Transmission fluid & filter $1,800 Annual service for automatic transmissions
Annual inspection & compliance $2,000 47-point inspection + FTA readiness
Preventive Maintenance Total: $20,000/year per bus (fleet total: $240,000)
Reactive Maintenance Approach (Same Fleet)
Scheduled maintenance (oil, filters, basics) $4,800 Minimal, emergency-only basis
Emergency brake repairs (failure mid-trip) $8,400 Breakdown repairs cost 3–4x scheduled service
Transmission repairs (fluid degradation failure) $7,200 Neglected fluid changes lead to costly repairs
Tire failures & emergency replacements $3,600 Running on worn tires leads to blowouts
Towing & emergency service calls $4,200 3–5 breakdowns per year @ $800–1,200 each
Downtime cost (lost revenue, reputation) $6,000 Missed trips, customer complaints, lost bookings
Reactive Maintenance Total: $34,200/year per bus (fleet total: $410,400)
Annual Difference
$14,200/bus/year | $170,400 for 12-bus fleet
Preventive maintenance saves 41% on annual maintenance cost AND prevents breakdowns that damage reputation
04Driver Training & Fuel Efficiency: The Margin Multiplier

Shuttle drivers control fuel cost through driving behavior. Aggressive acceleration and braking, speeding, and excessive idling can reduce fuel economy 20–30% relative to smooth driving. A shuttle fleet averaging 6.5 MPG could achieve 7.5–8 MPG with driver training. The difference: $324,000 annual fuel cost (at current consumption) vs. $280,000 (with improved efficiency) = $44,000 savings. For a 26% margin fleet earning $475,000 total profit, that's a 9% margin improvement from driver training alone. Most shuttle operators don't invest in systematic driver training. They hire, hand over keys, and hope for the best. The best shuttle operators make training mandatory: pre-hire orientation (safety, procedures, customer service), ongoing coaching (quarterly feedback on fuel economy and driving safety), and annual recertification (refresher training on compliance and efficiency). The total cost: $3,000–5,000 per driver per year. The benefit: $44,000+ in fuel savings plus reduced tire wear, reduced brake wear, and improved safety (fewer accidents). ROI: 8–15x in year one.

Driver Behavior Impact on Fuel Economy & Maintenance
Trained Driver (Smooth Driving)
Fuel economy7.8 MPGSmooth acceleration, steady speed
Brake wear rateNormalAnticipates stops, gentle braking
Tire wear rateNormalMaintains tire pressure, smooth cornering
Annual fuel cost (60k miles)$23,0777,692 gallons @ $3.00/gal
Annual wear & maintenance impactBaselineNormal service intervals, longer component life
Untrained Driver (Aggressive Driving)
Fuel economy6.2 MPGHard acceleration, high idle, speeding
Brake wear rate+45%Hard braking, late stopping decisions
Tire wear rate+35%Hard cornering, poor pressure maintenance
Annual fuel cost (60k miles)$29,0329,677 gallons @ $3.00/gal
Annual wear & maintenance impact+$3,200Premature brake/tire replacement
Annual Cost Difference Per Driver
$8,955 (fuel + accelerated wear)
12 drivers × $8,955 = $107,460 annual fleet benefit from training
05The Integrated Approach: Cost Control System

Shuttle cost control isn't one practice. It's integrated: utilization optimization feeds route efficiency which informs preventive maintenance schedules; driver training improves fuel economy and reduces maintenance; preventive maintenance eliminates breakdowns which improves reputation which increases bookings which increases utilization. The practices compound. A shuttle fleet that masters all four (utilization, preventive maintenance, driver training, route efficiency) operates at 32–35% margin. A fleet that ignores them operates at 18–22% margin. For a $1.8M revenue fleet, that's a $252,000 annual difference. This isn't growth. It's operational discipline. Implementation requires systems: a dispatch/scheduling system that tracks utilization and optimizes routes, a CMMS that ensures preventive maintenance on schedule, a telematics system that tracks driver behavior and fuel economy, and a training program that's mandatory and measured. These tools cost $30,000–50,000 annually. The benefit is 10x that in cost reduction and margin improvement.

Integrated Cost Control: Implementation Roadmap
Month 1–2: Foundation
Implement dispatch/scheduling system (track utilization daily)
Set up CMMS (transition to preventive maintenance schedule)
Install telematics (baseline driver behavior & fuel economy)
Benefit: Visibility into costs and utilization gaps
Month 3–4: Quick Wins
Begin driver training program (quarterly feedback on fuel economy)
Optimize routes (consolidate shuttles, reduce deadhead miles)
Start preventive maintenance rollout (schedule oil changes, tire rotations)
Benefit: 3–5% margin improvement within 4 months
Month 5–12: Optimization
Continuous driver coaching (fuel economy benchmarking, safety scoring)
Full preventive maintenance schedule (all PM on schedule)
Dynamic route optimization (adjust for seasonal demand)
Benefit: 8–12% margin improvement sustained throughout year
Year 1 Result: 26% margin → 34–38% margin (from integrated practices) | $1.8M fleet: +$144,000–$216,000 annual profit
Shuttle Operations Expert

Shuttle fleet margins are won or lost on operational discipline, not fleet age or route desirability. The best shuttle operators understand their utilization rate obsessively, maintain buses preventively (not reactively), train drivers on fuel efficiency and customer service, and optimize routes continuously. These aren't advanced practices. They're foundational. A competitor executing all four will have 15% margin advantage over an operator executing none. On a $1.8M revenue fleet, that's $270,000 per year. Sustainable shuttle profitability requires systems, not heroics.

The Bottom Line

Shuttle fleet margins are thin and compressible. The difference between profit and loss is operational excellence: utilization optimization, preventive maintenance, driver training, and route efficiency. These four practices are not optional. They're essential. A shuttle operator who implements all four builds margins that sustain through economic downturns. A competitor who ignores them will struggle to survive. The question isn't whether these practices matter. It's whether you'll implement them before a competitor does.

Shuttle Fleet Cost Control Platform
Utilization tracking, preventive maintenance, driver training, route optimization—all integrated. Build sustainable margins. Free 14-day trial.
Frequently Asked Questions
What's a healthy utilization rate for a shuttle fleet?
Target 70–80% utilization. Hotel shuttles: 65–75% (irregular demand). Airport shuttles: 75–85% (more predictable). Corporate shuttles: 60–70% (office hours only). Below 60% indicates overcapacity. Above 85% leaves no buffer for maintenance or peak demand. Monitor weekly and adjust fleet size if trend deviates by 10%+.
How do I measure and improve fuel economy?
Install telematics (GPS + sensors) on all buses. Track MPG per vehicle per route. Identify outliers (buses running 10%+ below fleet average). Coach those drivers on smooth acceleration, steady speed, and proper tire pressure. Target: 1 MPG improvement = $36k annual savings on 12-bus fleet.
What's the ROI on implementing a CMMS for shuttle fleets?
Typical ROI is 100–300% in year one. A $20k CMMS investment typically returns $20k–60k in maintenance cost reduction (fewer emergency repairs, longer component life) plus operational benefits (zero preventable breakdowns). Payback: 4–6 months.
Can I use driver behavior data without creating resentment?
Frame telematics as a tool for driver support and safety, not punishment. Share fuel economy benchmarks (how drivers compare to peers), provide coaching on smooth driving, and recognize top performers. Transparent communication reduces resistance. Most drivers accept monitoring when they see the benefit to safety and their own paycheck (incentive bonuses for efficiency targets).
How often should shuttle buses receive maintenance?
Follow OEM recommended intervals, but tighten them for shuttle use: oil changes every 12k–15k miles (vs. 20k), brake inspections quarterly (vs. annually), tire rotations every 10k miles. Shuttle buses run continuous light-duty cycles; PM intervals should reflect this. Quarterly 47-point inspections recommended for compliance and early defect detection.
What's the best shuttle scheduling strategy?
Dynamic scheduling based on demand patterns. Peak times: batch pickups into larger buses, minimize deadhead. Off-peak times: use smaller shuttle vehicles, combine routes. Use dispatch software that tracks real-time demand and suggests route consolidations. Goal: minimize empty miles while maintaining service levels.
Shuttle Operations Built on Data
Utilization, maintenance, driver training, route optimization—tracked and optimized in one system. Turn thin margins into sustainable profit. Free trial, no credit card.


Share This Story, Choose Your Platform!
