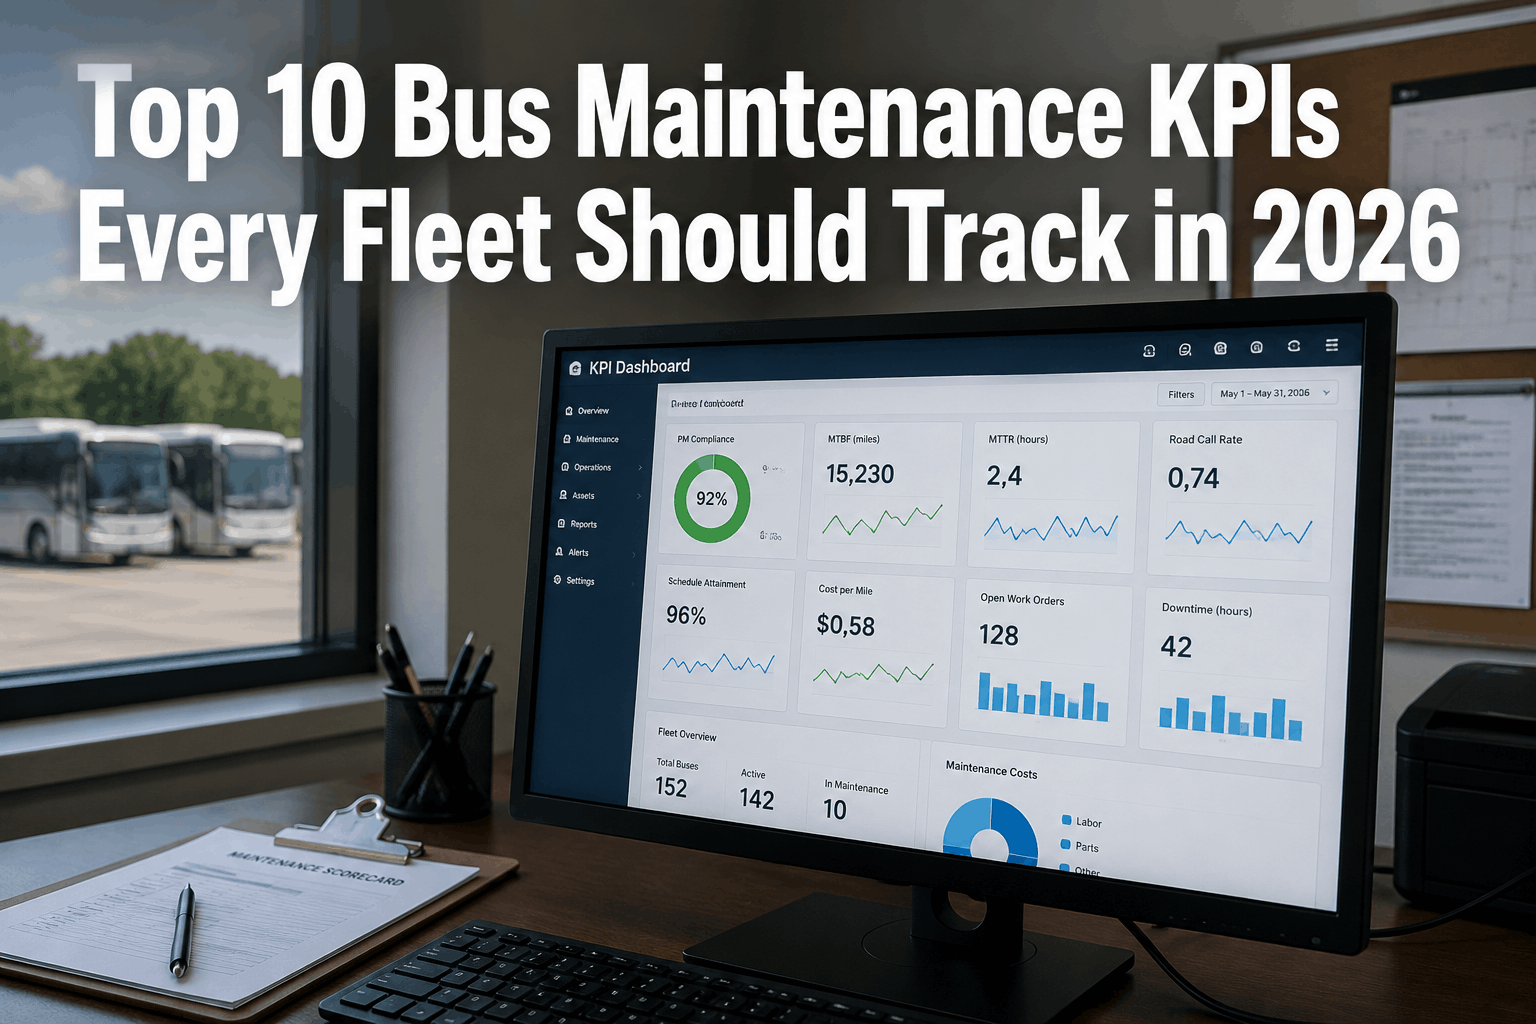
Tracking the right maintenance KPIs is essential for optimizing fleet performance, reducing costs, and improving reliability. In 2026, successful fleets use data-driven decisions to improve PM compliance, reduce breakdowns, and extend asset life. This guide covers the top 10 bus maintenance KPIs every fleet should track — PM compliance, MTBF, MTTR, road call rate, schedule attainment, cost per mile, and more — with definitions, targets, and improvement strategies.
Fleet KPIs Guide 2026
Top 10 Bus Maintenance KPIs Every Fleet Should Track in 2026
Top 10 bus maintenance KPIs every fleet should track in 2026. PM compliance, MTBF, MTTR, road call rate, schedule attainment, cost per mile — explained.
KPI Impact: The Cost of Not Measuring
Fleets that don't track KPIs operate blindly, missing opportunities to reduce costs and improve reliability. Measuring the right KPIs can reduce maintenance costs by 15-25%, improve fleet availability by 10-20%, and extend asset life by 20-30%.
15-25%
Maintenance cost reduction
10-20%
Fleet availability improvement
20-30%
Extended asset life
10
Essential KPIs to track
Top 10 Bus Maintenance KPIs
1. PM Compliance
Definition: Percentage of scheduled PMs completed on time. Target: 100%. Why: Missed PMs cause breakdowns and costly repairs.
2. Mean Time Between Failures (MTBF)
Definition: Average time between equipment failures. Target: Increasing trend. Why: Higher MTBF means better reliability.
3. Mean Time To Repair (MTTR)
Definition: Average time to complete repairs. Target: Decreasing trend. Why: Faster repairs reduce downtime.
4. Road Call Rate
Definition: Number of roadside failures per 100,000 miles. Target: Decreasing trend. Why: Road calls indicate maintenance gaps.
5. Schedule Attainment
Definition: Percentage of scheduled work completed on schedule. Target: 90%+. Why: Indicates shop efficiency and planning.
6. Cost Per Mile
Definition: Total maintenance cost divided by miles driven. Target: Decreasing or stable. Why: Tracks maintenance efficiency and cost control.
7. Fleet Availability
Definition: Percentage of buses available for service. Target: 95%+. Why: Directly impacts service levels and revenue.
8. First-Time Fix Rate
Definition: Percentage of repairs completed on first attempt. Target: 90%+. Why: Reduces repeat repairs and improves efficiency.
9. Parts Inventory Turnover
Definition: How quickly parts are used and replaced. Target: Optimized turnover. Why: Balances availability with carrying costs.
10. Safety Inspection Pass Rate
Definition: Percentage of buses passing safety inspections. Target: 100%. Why: Safety is paramount for passenger and driver protection.
KPI Performance Trends
PM compliance and fleet availability show consistent improvement from 65% to 95% over seven years with proper KPI tracking. Regular monitoring and reporting drive continuous improvement in both metrics. Fleet availability typically lags PM compliance by 5-10%.
KPI Benchmark Comparison
PM compliance, MTBF, schedule attainment, and first-time fix rate typically show the highest performance in well-managed fleets. Road call rate and cost per mile often require more focus and improvement. Track all KPIs to identify improvement opportunities.
KPI Requirements for Fleet Success
Data Collection
Collect accurate data from maintenance records, telematics, and work orders. Consistent data collection is essential for reliable KPI tracking.
Dashboard & Reporting
Track KPIs on a real-time dashboard. Generate weekly and monthly reports. Share results with all stakeholders.
Target Setting
Set realistic targets based on industry benchmarks. Adjust targets as performance improves. Celebrate achievement of targets.
Root Cause Analysis
When KPIs are off-target, investigate root causes. Implement corrective actions. Track improvement over time.
Continuous Improvement
Use KPIs to drive continuous improvement. Set higher targets as performance improves. Share best practices across the fleet.
Technology Integration
Integrate KPI tracking with your CMMS and telematics. Automate data collection for accuracy and efficiency.
KPI Scoring and Benchmarking
PM Compliance Score
95-100% = Excellent | 85-94% = Good | 70-84% = Fair | Below 70% = Poor. Target 100% for best results.
MTBF Score (miles)
10,000+ = Excellent | 7,000-9,999 = Good | 4,000-6,999 = Fair | Below 4,000 = Poor. Higher is better.
MTTR Score (hours)
Under 4 = Excellent | 4-6 = Good | 6-8 = Fair | Over 8 = Poor. Lower is better.
Road Call Rate (per 100k miles)
Under 2 = Excellent | 2-4 = Good | 4-6 = Fair | Over 6 = Poor. Lower is better.
Cost Per Mile ($/mile)
Under $0.60 = Excellent | $0.60-0.80 = Good | $0.80-1.00 = Fair | Over $1.00 = Poor.
First-Time Fix Rate
95-100% = Excellent | 85-94% = Good | 70-84% = Fair | Below 70% = Poor.
KPI Tracking KPIs
Track these five metrics to measure your KPI tracking program effectiveness:
KPI Data Accuracy
Target: 98%+ accuracy. Track monthly. Inaccurate data leads to wrong decisions.
KPI Reporting Frequency
Target: Weekly reporting. Track monthly. Regular reporting drives accountability.
KPI Achievement Rate
Target: 80%+ of targets met. Track monthly. Low achievement indicates unrealistic targets.
Dashboard Usage
Target: 100% of managers using dashboard. Track monthly. Low usage indicates training or tool issues.
KPI Improvement Rate
Target: 5%+ improvement annually. Track annually. Stagnant KPIs indicate lack of focus.
Our fleet of 200 buses implemented a KPI dashboard in 2024. In the first year, PM compliance improved from 82% to 97%. Road call rate decreased by 45% from 5.2 to 2.8 per 100,000 miles. Cost per mile decreased from $0.92 to $0.74. Fleet availability improved from 89% to 96%.
Digitize Your KPI Tracking with BusCMMS
BusCMMS provides real-time KPI dashboards for PM compliance, MTBF, MTTR, road call rate, schedule attainment, cost per mile, and more. Track performance by bus, depot, and technician. Generate automated reports and identify improvement opportunities. Book a demo to see how BusCMMS transforms KPI tracking.
Bus Maintenance KPI FAQs
What are the most important bus maintenance KPIs?
The most important KPIs are PM compliance (100% target), fleet availability (95%+ target), MTBF (increasing trend), MTTR (decreasing trend), road call rate (decreasing trend), and cost per mile (decreasing or stable). These six KPIs provide a comprehensive view of fleet health.
How do I calculate MTBF for buses?
MTBF = Total operating hours / Number of failures. For buses, use mileage instead of hours: MTBF = Total miles driven / Number of breakdowns. Track MTBF by bus type and age. Higher MTBF indicates better reliability.
What is a good road call rate for buses?
A road call rate under 2 per 100,000 miles is excellent. 2-4 is good. 4-6 is fair. Over 6 is poor. School buses in urban areas may have higher rates due to stop-and-go driving. Track trends and investigate spikes.
How do I improve PM compliance?
Improve PM compliance by: using automated scheduling, sending alerts to technicians, tracking completion in real-time, investigating missed PMs, and holding teams accountable. BusCMMS automates PM scheduling and tracking, improving compliance to 95%+.
What is a good cost per mile for bus maintenance?
Cost per mile varies by bus type and region. Under $0.60 per mile is excellent. $0.60-0.80 is good. $0.80-1.00 is fair. Over $1.00 is poor. Track cost per mile by bus type to identify improvement opportunities.
Can BusCMMS track fleet KPIs?
Yes. BusCMMS tracks all maintenance KPIs including PM compliance, MTBF, MTTR, road call rate, schedule attainment, cost per mile, fleet availability, and first-time fix rate. The system provides real-time dashboards, automated reports, and trend analysis to help you improve fleet performance.
The Bottom Line
Tracking the right maintenance KPIs is essential for optimizing bus fleet performance in 2026. The top 10 KPIs — PM compliance, MTBF, MTTR, road call rate, schedule attainment, cost per mile, fleet availability, first-time fix rate, parts inventory turnover, and safety inspection pass rate — provide a comprehensive view of fleet health. PM compliance and fleet availability should be monitored daily. MTBF, MTTR, and road call rate should be tracked weekly. Cost per mile and parts inventory turnover should be reviewed monthly. First-time fix rate and safety inspection pass rate should be tracked quarterly. When combined with proper data collection, dashboard reporting, and continuous improvement processes, these KPIs help fleets reduce maintenance costs by 15-25%, improve availability by 10-20%, and extend asset life by 20-30%.


