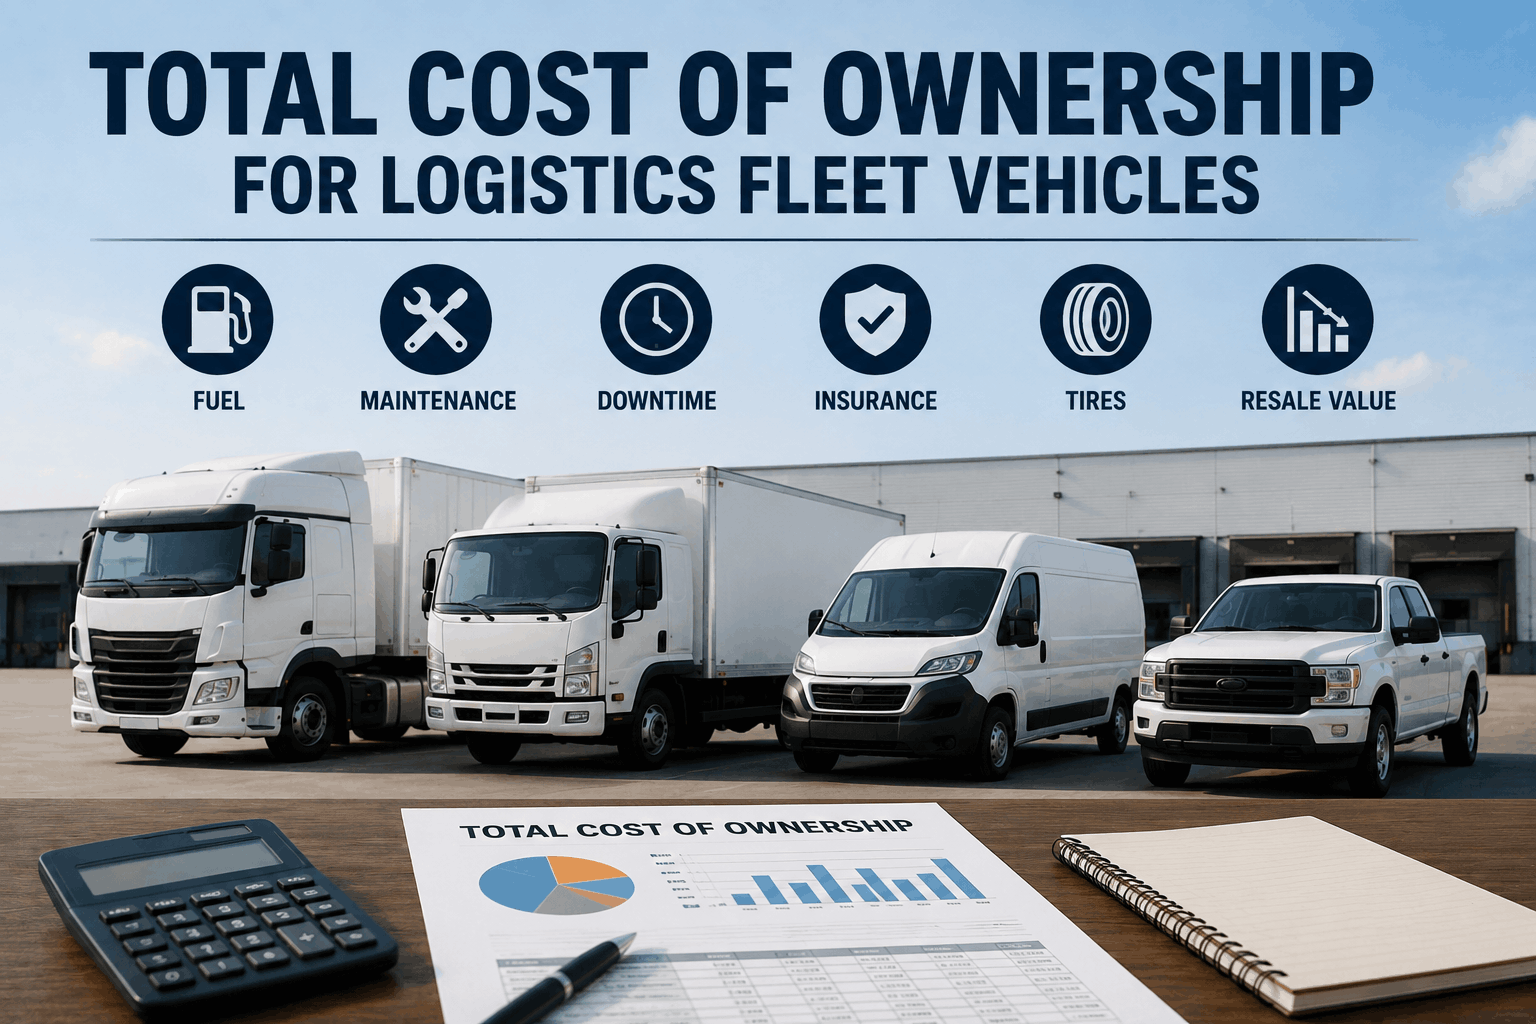
A logistics manager buys a new delivery truck for $45,000. He calculates the cost: $45,000. Three years later, the truck has cost him $127,000. Same truck. The difference is what came after the purchase: fuel ($38,000 across three years), maintenance ($22,000), tires and wear items ($12,000), insurance ($8,000), registration and licensing ($2,000), and lost productivity from breakdowns ($4,000). Purchase price was 35% of total cost. The other 65% was invisible during the buying decision. This is TCO — Total Cost of Ownership. Most fleet managers calculate it wrong. They compare purchase price, pick the cheapest option, and get surprised by the true cost over the vehicle's lifetime. The managers who win understand that a $45,000 truck costing $127,000 total is not expensive if it delivers 300,000 miles of reliable service. A $35,000 truck that costs $156,000 total and delivers 200,000 miles is far more expensive. TCO isn't about the price tag. It's about the total economic impact of that vehicle over its entire useful life.
Purchase price is 35% of total cost. The other 65% determines if your fleet wins or loses.
TCO is the sum of all direct and indirect costs associated with owning and operating a vehicle over its useful life. The formula is simple: Purchase Price + Fuel + Maintenance + Wear Items + Insurance + Registration/Tax + Downtime Cost - Residual Value = TCO. But implementation is complex because each component has hidden variables. Fuel cost depends on MPG (which degrades over time), fuel prices (volatile), and driver behavior (varies). Maintenance cost depends on vehicle age, usage intensity, and preventive care quality. Wear items (tires, brakes, fluids) follow OEM intervals but vary by usage. Insurance cost depends on vehicle type, age, and claims history. Downtime cost is the most ignored: a truck broken down for 3 days loses $600+ in revenue. Residual value depends on market demand and condition. Most fleet managers count purchase price, fuel, and maintenance, then miss the rest. The ones who win count everything.
Vehicle cost is not linear. A new truck costs $45,000 year one. Year two, it costs $42,000 (depreciation), but maintenance starts climbing. Year three, maintenance accelerates. Year four and beyond, repair costs exceed depreciation loss. A truck that was "worth" $45,000 at purchase is "worth" $25,000 at year three (40% loss), but maintenance has cost $22,000 to keep it running. By year six, the truck is worth $12,000, but maintaining it costs $6,000 annually (50% of residual value). This is when a fleet should consider replacement. The inflection point — where a vehicle's maintenance cost exceeds its economic value — is different for every fleet, every vehicle type, and every usage pattern. But it exists for every vehicle. Most fleets miss it because they don't track TCO. They keep running aging vehicles that cost more to maintain than they're worth, or they replace vehicles too early because they don't understand the true cost picture.
Three trucks at different price points, all designed for logistics. Truck A: $35,000, expected 180,000 miles, 8 MPG. Truck B: $45,000, expected 300,000 miles, 7 MPG. Truck C: $55,000, expected 400,000 miles, 6.5 MPG. A fleet manager sees only the prices and picks Truck A (lowest cost). But TCO tells a different story. Truck A costs $35,000 + (22,500 gallons × $3.50) + maintenance ($18,000) + insurance ($7,000) = $113,500 across lifetime. Cost per mile: $0.63. Truck B costs $45,000 + (42,857 gallons × $3.50) + maintenance ($24,000) + insurance ($8,000) = $185,857 across lifetime. Cost per mile: $0.62. Truck C costs $55,000 + (61,538 gallons × $3.50) + maintenance ($32,000) + insurance ($9,000) = $293,538 across lifetime. Cost per mile: $0.73. The "cheapest" truck is actually the most expensive per mile over its lifetime. Truck B, despite the higher purchase price, delivers the best TCO because it runs longer and more reliably. A proper TCO analysis flips the purchase decision 50% of the time.
Fuel is the second-largest TCO component after depreciation. A 1 MPG difference seems small — it compounds into thousands over a vehicle's lifetime. A truck running 150,000 miles at 7 MPG costs $75,000 in fuel (21,429 gallons × $3.50). The same truck at 8 MPG costs $65,625 in fuel (18,750 gallons). The difference: $9,375 over the vehicle lifetime. Most fleets ignore this because it feels small year-to-year ($3,000/year), but it's the second-largest total cost. Fuel-efficient vehicles (newer models, regular maintenance, driver training) have lower TCO than older, less-efficient vehicles, even if purchase price is higher. A fleet that focuses on fuel efficiency — keeping tires properly inflated, engines well-maintained, drivers trained — can reduce TCO by 10–15% across the fleet.
Most fleets retire vehicles based on arbitrary rules ("replace every 7 years" or "replace at 300,000 miles"). Better strategy: retire when maintenance cost exceeds economic value. A truck worth $8,000 in resale value, with $400/month in maintenance costs, is costing $4,800/year to keep running — 60% of its value. At that point, replacement makes sense. The truck's age is irrelevant. Some fleets keep trucks to 500,000+ miles because they're well-maintained. Others retire at 200,000 miles because maintenance has become expensive. The right metric is cost per mile and trend. If maintenance cost per mile is rising (year-over-year increase), replacement is near. If maintenance cost per mile is stable, the vehicle is still economical. The fleets with lowest total fleet cost don't keep vehicles too long or retire them too early. They retire them at the economic inflection point where the next year's maintenance cost exceeds the economic benefit of keeping the vehicle.
TCO flips conventional fleet economics. The cheapest truck to buy is often the most expensive to own. A fleet with real TCO visibility — purchase price, fuel, maintenance, downtime, residual value — makes purchasing decisions 50% more effectively than fleets operating blind. TCO changes the conversation from "What's the lowest purchase price?" to "What vehicle delivers the lowest cost per mile over its useful life?" That question drives purchase decisions, replacement timing, and maintenance investment that actually reduce total cost.
A vehicle's purchase price is the starting point, not the destination. TCO is the journey: fuel, maintenance, downtime, insurance, registration, and everything else that happens after you sign the check. A fleet that calculates TCO makes smarter purchasing decisions, retires vehicles at the right time, and invests in fuel efficiency and maintenance that actually reduce total cost. Purchase price alone is a losing metric. TCO per mile is the winning metric.


