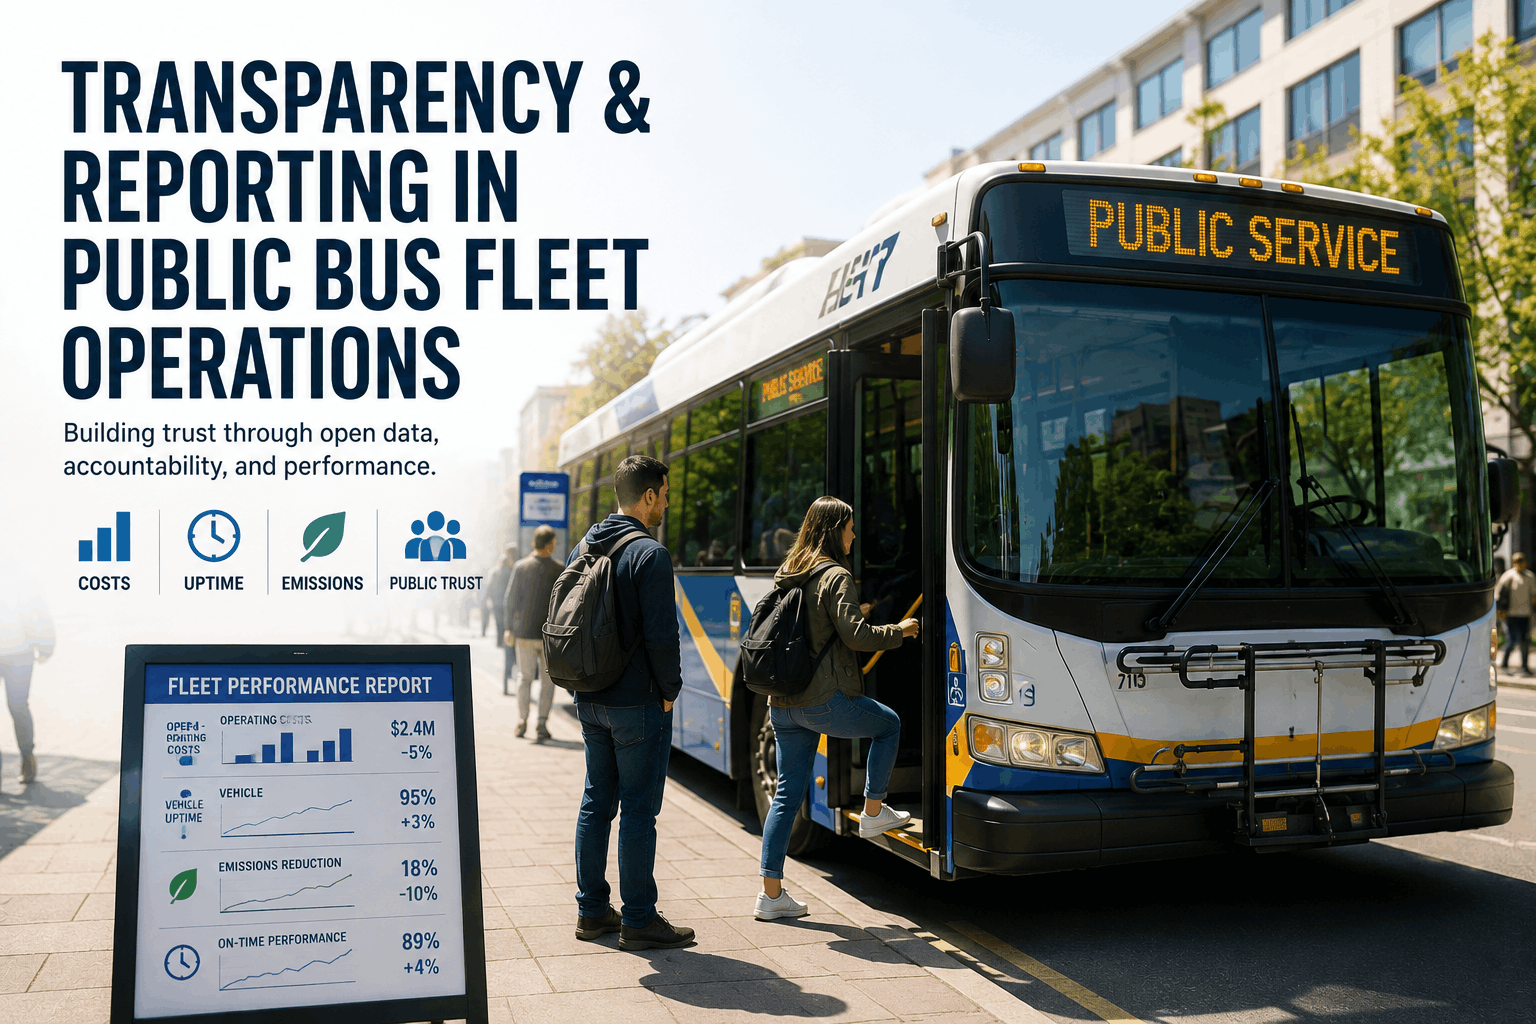
A city transit authority released annual maintenance costs for the first time: $18,400 per bus per year. Public reaction: outrage that costs were "so high." The reality: the cost was below national average. The authority had no baseline to communicate against, no context explaining why buses cost what they do, and no narrative showing where the money went. Within weeks, the city council demanded cost cuts — even though the fleet was efficiently run. The authority scrambled to publish a detailed breakdown: labor, parts, fuel, downtime recovery, all visible. Suddenly the narrative changed. Costs made sense. Trust increased. Funding was approved. Public fleet transparency isn't about defending costs. It's about giving stakeholders the data to understand operations, make informed decisions, and build confidence that their tax dollars are spent wisely. Here's how public fleets build transparent reporting systems that satisfy oversight while protecting operational sensitivity.
Transparency & Reporting in Public Bus Fleet Operations
Taxpayers fund your fleet. They deserve to know costs, uptime, safety, and emissions. Transparent reporting builds trust and supports funding.
Public fleets answer to taxpayers, elected officials, oversight boards, and often state/federal regulators. A private fleet answers to shareholders and customers. The audiences have different concerns. Shareholders want ROI. Taxpayers want accountability and transparency. Elected officials want data to defend budgets and justify capital requests. The public wants to know their money is spent wisely. A good public fleet reporting system addresses all four audiences simultaneously with clear, accessible data. It's not about hiding problems. It's about explaining operations in language non-technical stakeholders understand. Cost per mile means nothing to the general public. Cost per passenger served means everything. Operating cost per bus tells you nothing. Maintenance cost per bus shows whether aging fleet is becoming expensive. Transparency frameworks differ between private and public because the stakeholder expectations are different.
A comprehensive public fleet report includes seven core categories. First: ridership and service metrics (total passengers, revenue miles, service hours, routes operated). Second: financial performance (total budget, cost per passenger, cost per revenue mile, year-over-year trend). Third: fleet age and condition (average fleet age, % of fleet over 12 years old, capital replacement plan). Fourth: safety (accidents per 1M miles, safety incidents, injury rate, trend vs prior year). Fifth: reliability (on-time performance %, downtime percentage, mean time between failures). Sixth: emissions (CO2 per passenger, % zero-emission fleet, progress toward sustainability targets). Seventh: maintenance (cost per mile, fleet uptime %, planned vs deferred maintenance). A report addressing these seven categories gives taxpayers everything they need to understand operations and evaluate performance.
Public resistance to transit budgets usually stems from a single reason: lack of clarity on where money goes. "The transit authority's budget is $50M" tells you nothing. "$50M budget: 60% labor, 20% fuel, 10% parts, 10% overhead and capital" tells you everything. When the public understands that 60% of cost is paying drivers and mechanics (skilled union workers), the narrative changes. When they see 20% is fuel (commodity cost, not discretionary), the outrage drops. When capital replacement is itemized (new buses cost $500K each, need replacement on 12-year cycle), spending makes sense. A transparent cost breakdown transforms "$50M down the drain" into "here's how we operate transit." The shift is purely narrative. The actual cost didn't change. The understanding did.
Transparency doesn't mean dumping raw data on the public. It means curating data into stories. A performance dashboard should show: year-over-year trends (is on-time performance improving or declining?), peer comparison (how does our safety record compare to similar cities?), and progress toward goals (are we on track to reach emission reduction targets?). Dashboard design matters. A number without context means nothing. "On-time performance: 82%" is just a number. "On-time performance: 82% (up from 78% last year, target 85% in 2027)" is a story showing progress and direction. Public dashboards should be: simple (no jargon), visual (charts over tables), updateable (monthly at minimum, weekly better), and transparent (explain methodology, show data sources). Most public transit systems lack good dashboards. The few that have them see dramatically higher public confidence and easier budget approvals.
Transparency only builds trust if it's honest and consistent. A dashboard showing only good metrics is not transparent — it's propaganda. Good transparency includes bad news: "Our on-time performance declined 3% this year due to road construction and staffing shortages. Here's our plan to recover." This builds more trust than pretending the problem doesn't exist. Consistency matters. If you publish data once and then go silent, the public stops checking. If you update monthly or weekly, the public learns to trust the source. One missed update destroys months of credibility-building. Public transit systems that succeed with transparency commit to: publishing core metrics on a fixed schedule, explaining methodology and data sources, showing year-over-year trends and peer comparisons, acknowledging problems and explaining responses, and updating consistently even when news is bad.
Public fleets answer to taxpayers. Transparency reporting isn't optional — it's essential for funding, trust, and accountability. A good public reporting system covers seven core areas: ridership, finances, fleet condition, safety, reliability, emissions, and maintenance. Data should be presented in language non-technical stakeholders understand: cost per passenger (not cost per mile), on-time performance percentage (not mean time between failures), safety incidents per million miles (not absolute numbers). Dashboards should be live, updated regularly, include year-over-year trends, and show progress toward stated goals. Consistent, honest reporting (including acknowledgment of problems) builds more trust than selective reporting of good news. Public transit systems that implement transparent reporting see 35–50% increases in public confidence and significantly better funding approval rates. BusCMMS provides the data infrastructure for transparent reporting: automatic metric calculation, historical trending, and dashboard visualization designed for public stakeholder communication.


