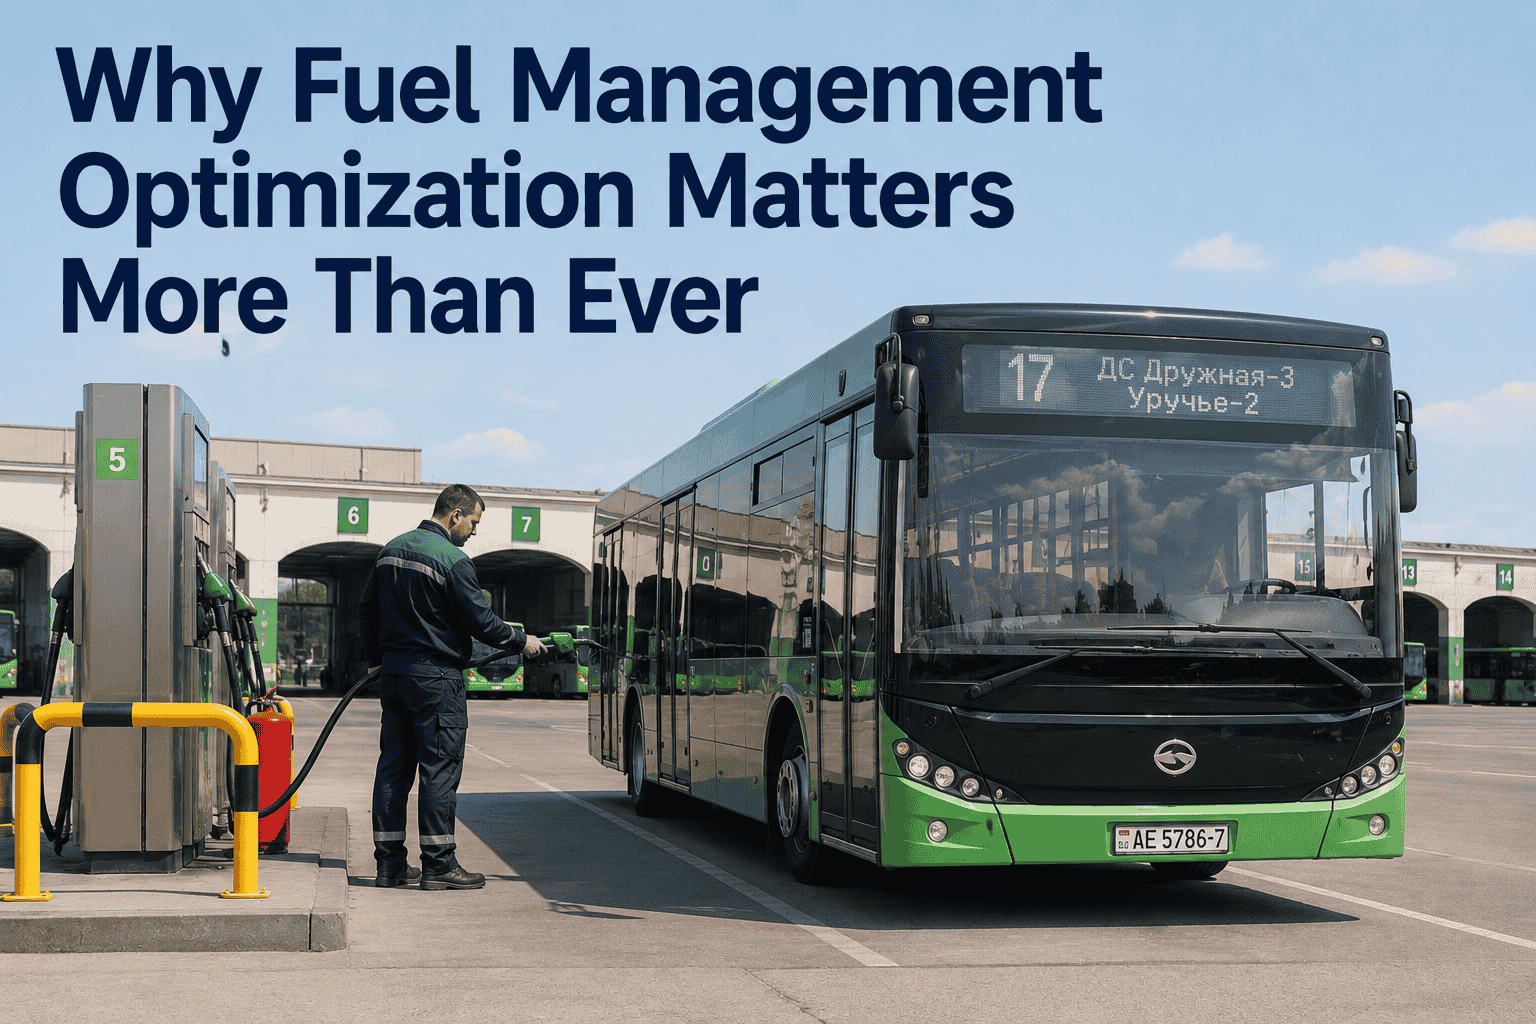
A school bus fleet of 85 vehicles spent $340,000 annually on fuel without tracking individual consumption parameters. They monitored total bulk volume costs but couldn't isolate which specific assets were draining their operating budget. Operational metrics later revealed that a single bus was averaging a low 4.2 MPG while the fleet baseline stayed at 5.8 MPG—silently costing the district an extra $18,000 per year entirely unnoticed. After implementing an integrated fuel management optimization platform, the agency connected live fuel data straight to vehicle service history profiles. They discovered that the inefficient vehicle simply suffered from a clogged fuel injector—a quick $200 garage repair that immediately reclaimed the $18,000 drain. Fuel tracking is much more than an accounting measure; it serves as an early mechanical diagnostic tool to catch engine wear long before unexpected route failures strike.
Fuel Operations 2026
Why Fuel Management Optimization Matters More Than Ever
Track consumption per vehicle asset. Identify hidden engine issues, optimize route efficiency, and secure a 10–20% reduction in annual fuel overhead.
Fuel Optimization Metrics — 85-Bus Fleet
Annual Fleet Fuel Expense (Untracked)$340,000 baseline
Hidden Capital Lost to Inefficiency$18K–$45K per year
Average Mechanical Resolution WindowWeeks (reactive wait)
Optimized Fuel Overhead Drop10–20% budget reduction
Average Platform ROI Window2–4 months tracking
Anomalies Flagged to Shop Desk Live100% telemetry matched
The primary constraint in traditional transit logistics is treating fuel strictly as a static financial expense. Unoptimized operations buy fuel in bulk, log the processing invoice, and overlook individual engine trendlines until a roadside breakdown forces a vehicle overhaul. When an asset's efficiency drops from 5.8 MPG down to 4.9 MPG, it isn't just consuming extra fuel—the vehicle is actively signaling a developing part error. Common underlying causes include restricted air filtration, worn fuel injectors, dropping tire pressure, or transmission slipping. Shifting to digital fuel management optimization integrates fuel card data directly with your centralized maintenance platform, automatically firing workshop alerts when a bus deviates from its established baseline consumption rate.
Siloed Fuel Management (High Risk)
Tracking PrecisionMonitored in aggregate totals, hiding individual vehicle drains.
Problem IdentificationDiscovered only after an engine component fails mid-route.
Cost ContainmentForced to absorb premium emergency road towing and repair bills.
Route AssessmentManagers cannot track if specific routes accelerate component wear.
Optimized Tracking Environment
Tracking PrecisionContinuous miles-per-gallon tracking mapped directly per asset.
Problem IdentificationA 10–15% efficiency drop auto-triggers diagnostic tasks live.
Cost ContainmentSmall garage fixes eliminate major unexpected line failures early.
Route AssessmentConsumption variances help map vehicle types to ideal route layouts.
Link fuel data to maintenance updates — book a demo
To run an optimized public transit or school bus operation, fleet directors measure energy efficiency against four baseline parameters. First: **Miles Per Gallon (MPG) Deviation**, tracking whether specific vehicles breach standard performance limits. Second: **Route-to-Asset Efficiency Matching**, highlighting if specific transit routes show unusually high idling or consumption loads. Third: **Preventive Maintenance Adherence Window**, ensuring filtration and calibration tasks execute precisely before fuel burn patterns spike. Finally: **Unalterable Historical Record Accuracy**, logging data streams securely to verify total operational integrity during performance reviews.
Fuel Optimization Performance Targets
Optimized System Target
10–20% Total Fuel Overhead Savings (Proactive Fleet)
Untracked Baseline Average
15–25% Latent Efficiency Waste (Reactive Fleet)
Average ROI Return Period
60–90 Day Full Capital Payback Timeline
Telemetry Integration Level
100% Automated Fuel Card Sync to Asset Profiles
Log your fleet efficiency targets — sign up free
A regional public transportation network operating 140 buses deployed integrated consumption analytics to resolve an unexplained rise in utility expenses. By cross-linking fuel card transactions straight to individual odometer records, the central platform flagged 12 buses consuming 20% more fuel than identical vehicles operating across the same routes. The software generated target work orders, sending the assets straight to diagnostics. Mechanics isolated four restricted filters, three faulty injector sets, and five vehicles suffering from low tire pressure. Resolving these minor mechanical variances required only $4,200 in total shop capital but returned a massive $68,000 in direct, recurring annual fuel savings.
Uncoordinated Energy Tracking
Fuel bills are processed by accounting without checking vehicle health indicators.
Internal powertrain defects remain hidden until an active road failure occurs.
Route planning software ignores true asset consumption patterns.
Driver execution habits lack clear tracking metrics or accountability loops.
Result: High operational waste, early asset decay, and soaring overhead.
Optimized Operational Strategy
Fuel transaction logs automatically sync to vehicle health profiles daily.
Efficiency alert parameters dispatch vehicles to the garage before part failures.
Route managers distribute vehicles based on accurate lifecycle statistics.
Clear data parameters help supervisors guide eco-friendly driving routines.
Result: Sustained budget reductions, extended engine life, and peak road readiness.
Review custom fuel reporting screens — book a demo
Centralizing your transit network's fuel metrics does not require modifying daily vehicle dispatch schedules. Following a structured 90-day implementation plan makes rollout easy for drivers, workshop personnel, and budget managers. Month one sets up daily automated imports from your existing fleet fuel cards straight into your core platform. Month two analyzes early consumption data to outline exact baseline parameters per vehicle type and route layout. The final month activates automated efficiency rules, generating diagnostic tasks whenever an asset drops below target benchmarks. This seamless workflow provides continuous budget protection with minimal management effort.
Fuel Optimization Integration Plan
Days 1–30
Connect existing fleet fuel card providers to automate transaction imports.
Days 31–60
Calculate accurate baseline metrics across vehicle models, seasons, and routes.
Days 61–90
Activate automated alert triggers for any vehicle showing a 10–15% efficiency drop.
Optimized 2026
Track high-level performance summaries to continually trim fleet operating overhead.
Launch your energy optimization portal — sign up free
Accepting high fuel costs because of disconnected paper tracking systems creates an ongoing financial vulnerability for bus operations. Moving to an integrated fuel management optimization platform connects transaction data, vehicle maintenance tracking, and route metrics into a single digital engine. Rather than reviewing generic budget reports at the end of the year, centralized software monitors consumption patterns and flags fuel anomalies live. This automated approach allows you to address powertrain faults during normal shop hours, eliminating premium roadside breakdown charges and extending total bus lifespans. Unifying these data streams is the most effective way to protect asset lifecycles and demonstrate complete operational discipline to stakeholders. BusCMMS provides the complete backend framework needed to automate transaction syncs, calculate custom baselines, alert on efficiency metrics, and launch proactive work orders.
Secure your fuel analytics system — book a demo
Streamline Energy Tracking. Catch Mechanical Faults Early. Save 10–20%.
Connect daily fuel card transactions directly to your maintenance profiles. Spot hidden component wear, lower repair costs, and maximize fleet uptime. Free 14-day trial.
What makes fuel management optimization distinct from basic fuel expense reporting?
Expense reporting tracks simple financial records after purchasing occurs. Optimization links transactional fuel metrics to individual vehicle odometers in real time, calculating performance trends and alerting shop teams to internal part issues before road failures strike.
How do centralized platforms sync with our current fleet fuel card providers?
Modern cloud software uses direct API integrations or automated daily transaction feeds from premium card companies (such as WEX, Fuelman, or Fleetwide). The platform imports data seamlessly, eliminating manual logging and paperwork errors.
Can tracking consumption variations accurately isolate a mechanical fault from a routing delay?
Yes. By comparing a vehicle's performance against identical buses operating on the exact same routes over a fixed timeline, the software isolates systemic trends. If a single bus's efficiency drops while peer assets remain steady, the issue is mechanical.
Does seasonal temperature variation alter our fleet's efficiency baseline curves?
Yes. Cold engines, dense winter air profiles, thermal heating demands, and changes in regional fuel blends naturally lower efficiency by 5–10% during winter months. Advanced platforms adjust baselines seasonally to maintain accurate alert thresholds year-round.
Do our workshop mechanics require advanced training to manage automated fuel alerts?
No. Complex data matching runs automatically in the cloud. When a bus breaches its target parameters, the software logs a clear, itemized repair task on the shop desk, routing the mechanic directly to standard powertrain diagnostics.
Which key parameters should fleet directors track to measure fuel optimization success?
Monitor individual miles-per-gallon (MPG) trends per vehicle asset class, average turnaround windows for fuel anomaly work orders, and total fleet energy overhead reduction. Tracking these metrics clearly indicates where your operating margins are expanding.
Turn Everyday Fuel Card Logs Into an Automated Vehicle Diagnostic Matrix.
Standardize consumption metrics, catch internal powertrain faults early, clear out hidden efficiency losses, and stabilize fleet operating budgets. Free 14-day trial.