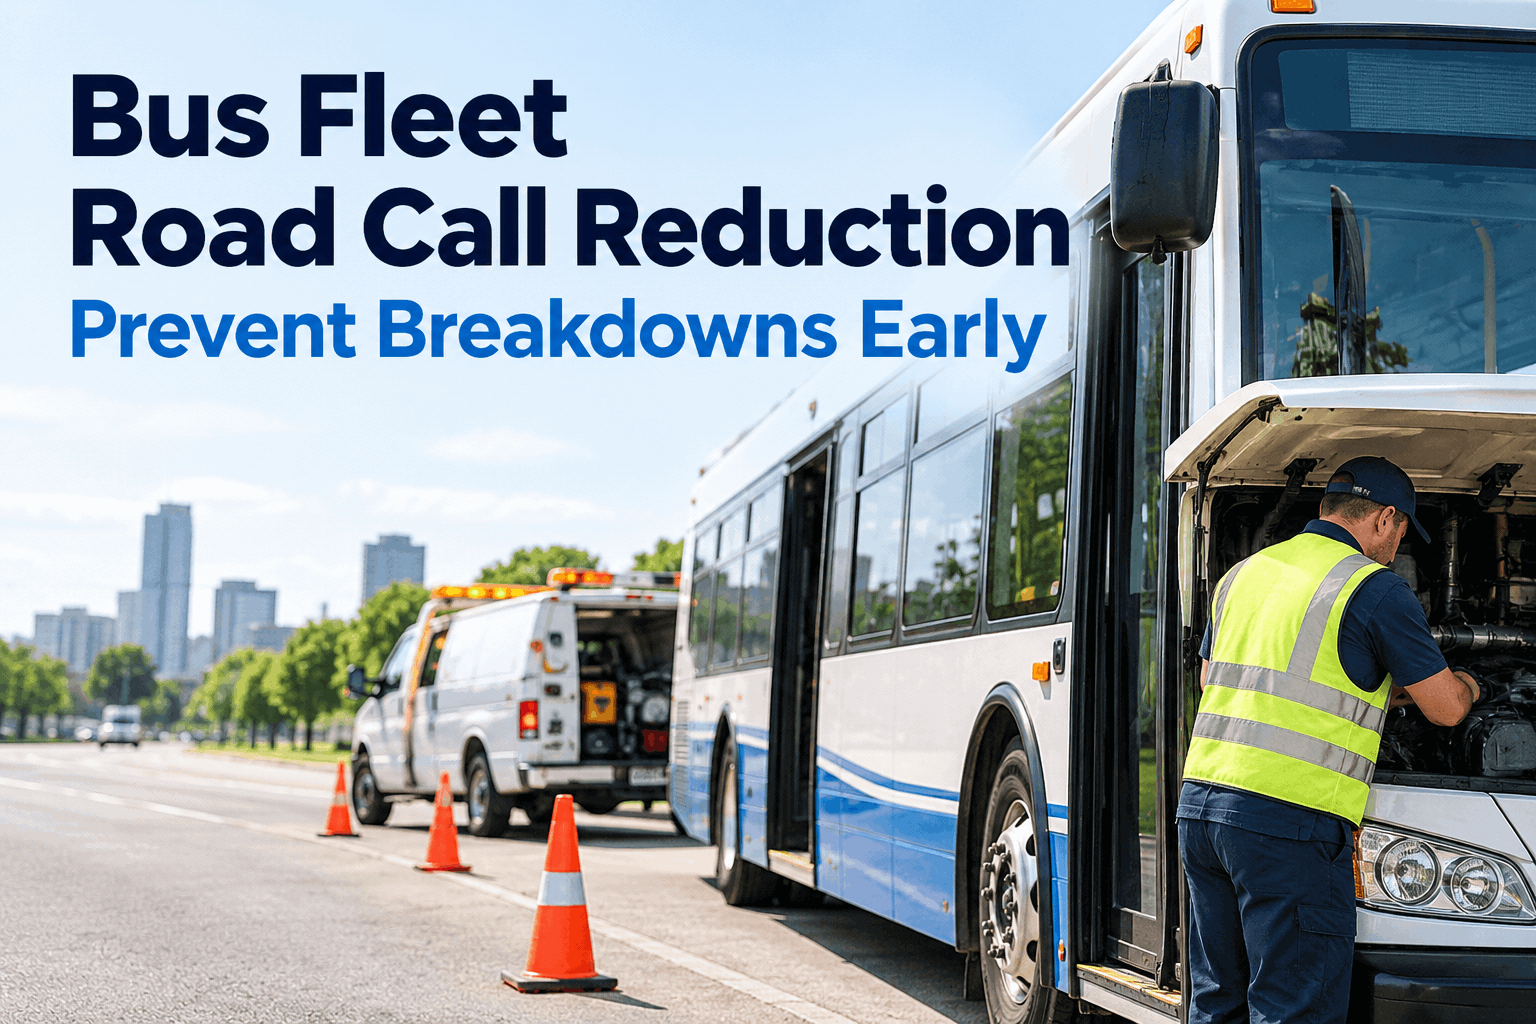
Peak pullout is 40 buses and you own 48. On a bad morning — three in the shop, two on road calls, one waiting on a part — that cushion of eight vanishes fast. What the cushion costs you is decided by one number: bus fleet availability. The higher it runs, the fewer spares you buy and insure to cover the same routes. You can see how availability sets your spare count in a demo.
Bus Fleet Availability: How Many Spare Buses You Really Need
Every point of availability you gain is a spare bus you don't have to own. This is the math that connects your availability rate to your spare ratio — and shows why raising uptime is cheaper than buying another bus to sit in reserve. Here is how the numbers link up.
Illustrative: at 85% availability a 40-bus pullout needs roughly seven spares; at 95% it needs about two. Each point of uptime is money you don't spend on reserve buses.
First, the Number: What Bus Fleet Availability Measures
Bus fleet availability is the share of your fleet that is ready for service when you need it — buses available divided by total buses, over a period. A 48-bus fleet with 6 down on an average morning is running about 87% availability. Simple to state; the value is in what it drives.
The formula is the easy part. The leverage is that this one percentage decides how many spare buses you must own to keep every route covered.
Measuring it is table stakes; the question this page answers is what the number buys you. A fleet analytics and reporting dashboard tracks availability live, and you can start measuring your own rate free.
How Availability Sets Your Spare Ratio
Your spare ratio is the reserve buses you keep per route bus — spares divided by peak requirement. Transit agencies often target around a 20% spare ratio, but that target assumes a given availability. Raise availability and you can safely run leaner; let it slip and you need more reserve just to stand still.
Low availability forces a fat spare ratio
If buses are frequently down, you must own extra ones to guarantee the pullout — capital, insurance, and storage spent on buses that mostly sit, just to cover the ones that break.
High availability lets you run lean
When buses are reliably ready, the same routes need far fewer spares. The money you were spending on reserve vehicles stays in the budget — or buys newer buses instead of more of them.
The trade is real money, not theory
A spare bus is a full capital asset plus insurance and upkeep. Shaving even one or two spares off a fleet by lifting availability is a line item a board notices.
That is the whole argument for chasing availability: it is almost always cheaper to make your buses more reliable than to buy more of them. A demo can run your peak and availability to size your spares.
The Three Metrics Behind Availability: MTBF, MTTR, and the Rate
Availability isn't a standalone number — it is the product of two others. How often buses fail (MTBF) and how fast you fix them (MTTR) together determine how many are ready at any moment. Move either lever and availability moves with it.
Fewer failures (higher MTBF) plus faster repairs (lower MTTR) equals more buses ready — the two things a maintenance system is built to move.
This is where the KPI connects to action: you lift availability by failing less and fixing faster, and both come from how you run maintenance. A strong preventive maintenance program is the lever on the MTBF side; stocked parts and a tight work-order flow are the lever on MTTR.
Your Availability-to-Spares Checklist
Turning availability into fewer spares is a tracking-and-discipline problem. Run this against your operation — the boxes you can't check are where availability leaks and your spare ratio quietly has to grow to compensate.
- Availability is measured daily, not guessedReady buses over total, tracked every morning — so you know your real rate, not a feeling about how the fleet is running.
- Downtime reasons are loggedEvery out-of-service bus has a cause — PM, road call, waiting on parts — so you can attack what is actually dropping availability.
- PM runs on schedule to lift MTBFPreventive maintenance that doesn't slip, so buses fail less often — the single biggest lever on availability.
- Parts are on the shelf to cut MTTRThe common parts stocked and reordered automatically, so a repair isn't a bus parked for a week waiting on a box.
- Work orders move fast through the shopA defect becomes a routed, tracked job with no hand-off lost — shrinking the repair time that keeps a bus out of service.
- Your spare ratio is reviewed against your rateSpares sized to your actual availability, not a fixed habit — so you aren't buying reserve buses to paper over fixable downtime.
Check these and your availability climbs while your spare count falls. If a few are open, that is the gap a short demo closes against your own fleet.
How BusCMMS Lifts Availability and Shrinks Spares
Availability rises when buses fail less and get fixed faster, and falls when downtime goes untracked. BusCMMS was built for buses, so it works all three levers at once — failures, repair speed, and the data to size spares — in one system.
PM that raises MTBF
Multi-trigger preventive maintenance catches wear before it fails a bus, so breakdowns drop and more buses stay ready — the failure side of availability.
Parts and work orders that cut MTTR
Auto-reorder keeps common parts on the shelf and work orders route straight to a tech, so repairs finish faster — the repair-time side of availability.
Availability analytics to size spares
Live availability, MTBF, and MTTR on one dashboard with downtime reasons — the data to prove your real spare ratio and defend running leaner.
BusCMMS reports fleets reaching 95%+ availability once failures drop and repairs speed up — the level where the same routes run on noticeably fewer spare buses.
A Fleet Manager's Take
Key Takeaways on Bus Fleet Availability
Bus fleet availability isn't just a KPI to report — it is the number that decides how many buses you have to own. Four things to carry out of this.
- 01Availability buys down your spare ratio. Every point of uptime is a reserve bus you don't have to purchase and insure.
- 02It's MTBF times MTTR. Fail less and fix faster and availability rises — both are maintenance levers, not luck.
- 03Reliability beats buying reserves. It is almost always cheaper to make buses more available than to own more of them.
- 04Measure the reasons, not just the rate. Logging why buses are down is what lets you raise the number and size spares honestly.
Track bus fleet availability as a lever, not a scoreboard — fail less, fix faster, log the reasons — and the spare ratio shrinks on its own. The cheapest extra bus is the one you already own but couldn't keep running.