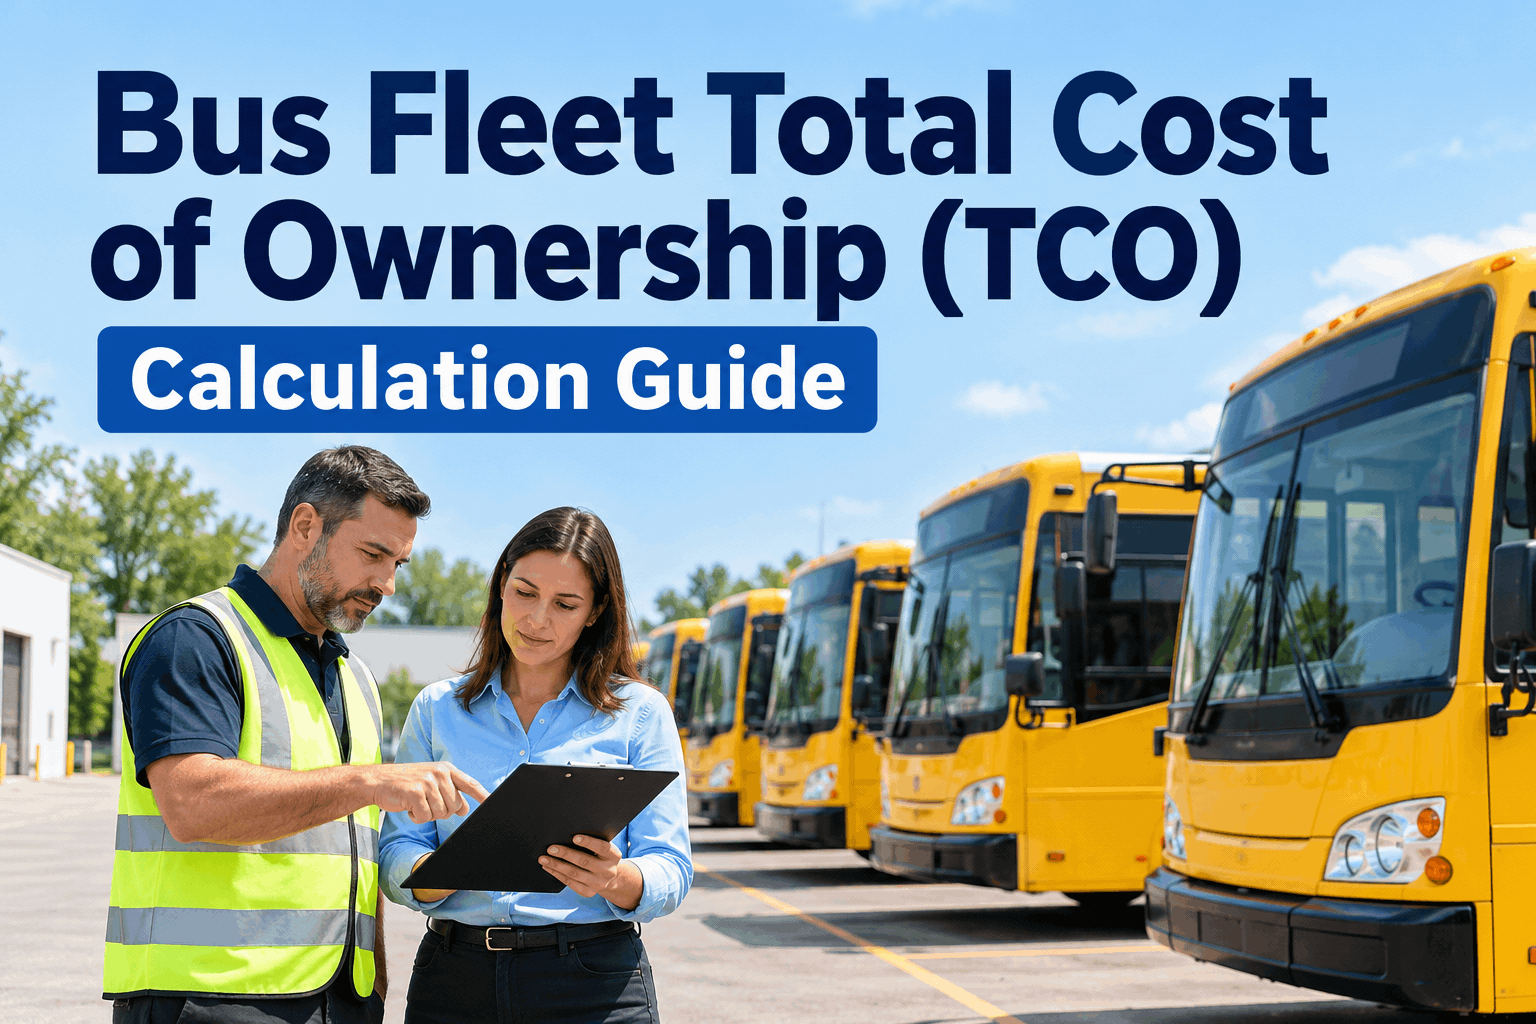
Two bus quotes land and one is $15,000 cheaper — easy call, until three years in the "cheaper" bus burns more fuel, sits in the shop more, and costs you a route a month. The sticker was never the price. A bus fleet total cost of ownership view counts everything a bus costs over its whole life, not just the purchase, so you compare what you'll actually pay. You can see your real per-mile cost of ownership in a demo.
Bus Fleet Total Cost of Ownership (TCO): Calculation Guide
Purchase price is the tip of the iceberg. The real cost of a bus is what it burns, breaks, and loses in value over ten-plus years in service. A TCO model surfaces the hidden bulk — so budgets, bus comparisons, and fuel-type decisions are made on the whole number. Here is how to build it.
Over a bus's life, the purchase price is often a minority of what it truly costs. TCO counts the submerged bulk the quote never shows.
The Cost Categories Inside a Bus's TCO
Total cost of ownership is a sum, and the trick is counting every term. Most budgets capture the obvious ones and miss the quiet ones — which is exactly where the surprises hide. Here are the categories a complete TCO model adds up over a bus's life.
Bar lengths are illustrative, not a fixed ratio — the mix shifts by bus, fuel type, and route. The point: TCO is the sum of all of it, minus what the bus is worth at the end.
Each of these is a line item many fleets track separately — fuel in one place, repairs in another, downtime nowhere. A fleet analytics and reporting dashboard pulls them into one view, and you can start capturing every cost category free.
How to Calculate Bus Fleet Total Cost of Ownership
The TCO model itself is simple arithmetic — the work is feeding it accurate numbers. You sum every lifecycle cost, subtract what the bus returns at the end, and divide by the miles it delivers to get a single, comparable figure.
The figure that lets you compare a $15,000-cheaper bus against the one that costs less to run — apples to apples, over the whole life.
The arithmetic is the easy part; the accurate inputs are the hard part, and that is a tracking problem. You can see the inputs captured automatically in a demo.
The Hidden Costs That Wreck a TCO Estimate
The categories that sink a budget are the ones that never hit a single invoice. A TCO model is only as honest as the quiet costs it remembers to count. Four that fleets routinely leave out — and shouldn't.
Downtime, not just the repair
A bus in the shop isn't running a route. The spare bus, the doubled run, the overtime — those cost real money the repair invoice never shows, and they climb as a bus ages.
The cost curve, not a flat average
Maintenance isn't flat over a bus's life — it's cheap early and steep late. A TCO built on a single average hides the expensive back half entirely.
Fuel or energy over the whole life
Over ten-plus years, fuel or energy is often the biggest single line in TCO — a small per-mile difference between two buses compounds into real money across the life.
Residual value at the end
What a bus is worth when you retire it offsets its TCO — and two buses with the same running cost can differ sharply in resale. Leave it out and your comparison is wrong.
Miss these and a TCO estimate flatters the wrong bus. Count them and the number finally tells the truth about what each bus costs to own.
Your Bus Fleet TCO Tracking Checklist
An accurate TCO model is really a data-capture problem — the math is trivial once the inputs are clean. Run this against your operation; the boxes you can't check are the costs your current TCO is silently guessing at.
- Acquisition cost is recorded per busPurchase or lease cost tied to each vehicle, so it anchors that bus's lifetime total — not a number lost in a procurement file.
- Fuel or energy is logged per busConsumption and cost tracked by vehicle — the biggest lifecycle line, and the one a per-bus average quietly smears.
- Maintenance and parts cost roll up per busEvery work order, part, and tire tied to a vehicle, so lifetime maintenance spend is a total, not a shrug.
- Downtime is captured, not ignoredRoad calls and out-of-service days logged, so the cost of a bus not running is in the model instead of invisible.
- Cost per mile is calculated and trendedThe combined figure tracked over time per bus — the single number TCO exists to produce.
- You can export it for a budget or comparisonOne-click reports so TCO backs a bus purchase, a budget, or a board request — evidence, not estimate.
Check these and your TCO is a fact you can defend. If a few are open, that is the gap a short demo closes against your own fleet.
How BusCMMS Captures Your True Cost of Ownership
The reason TCO stays a guess for most fleets is that the inputs live in different places — fuel in a card statement, repairs in a binder, downtime nowhere. BusCMMS was built for buses, so the cost pieces land in one system as the work happens and roll into TCO on their own.
Fuel and cost tracking per bus
Fuel consumption and cost logged by vehicle, driver, and route, with card reconciliation — the largest TCO line, captured accurately instead of averaged.
Repair, parts and downtime per bus
Every work order, part, and road call tied to a vehicle — so maintenance spend and downtime are totals in the model, not costs that slip through.
Cost-per-mile analytics and exports
All of it rolled into cost per mile by bus, trended over time, and exportable for a budget or purchase comparison — TCO as a living number, not an annual scramble.
Seeing the whole number is how fleets cut it: BusCMMS reports districts and agencies trimming costs 25-35% within 12 months and saving around $2,800 per bus a year once TCO is visible instead of scattered.
A Fleet Finance Manager's Take
Key Takeaways on Bus Fleet Total Cost of Ownership
Bus fleet total cost of ownership is the number that tells you what a bus actually costs — not what it costs on day one. Four things to carry out of this.
Sticker price is the tip
Fuel, maintenance, downtime, and value loss over the life usually dwarf the purchase price.
TCO per mile is the comparison
Sum lifecycle costs, subtract residual, divide by miles — one number that compares buses honestly.
The hidden costs decide it
Downtime, the rising cost curve, and residual value are what a sticker-price comparison misses.
It's a tracking problem
The math is trivial; clean per-bus inputs are the work, and that is what a maintenance system supplies.
Build your bus fleet total cost of ownership on the real, per-bus data your maintenance system already collects, compare on cost per mile instead of sticker price, and the $15,000-cheaper bus that quietly costs more finally shows its true price. The quote was only ever the beginning of the bill.