Bus 38 came back Thursday for the brake fault you signed off Monday. New work order, another tech, more parts — two separate jobs on paper, so nobody adds them up. That's rework, and it's the cost your shop never sees. Bus shop rework cost tracking turns those comebacks into a number you can manage. See comeback costs in a demo.
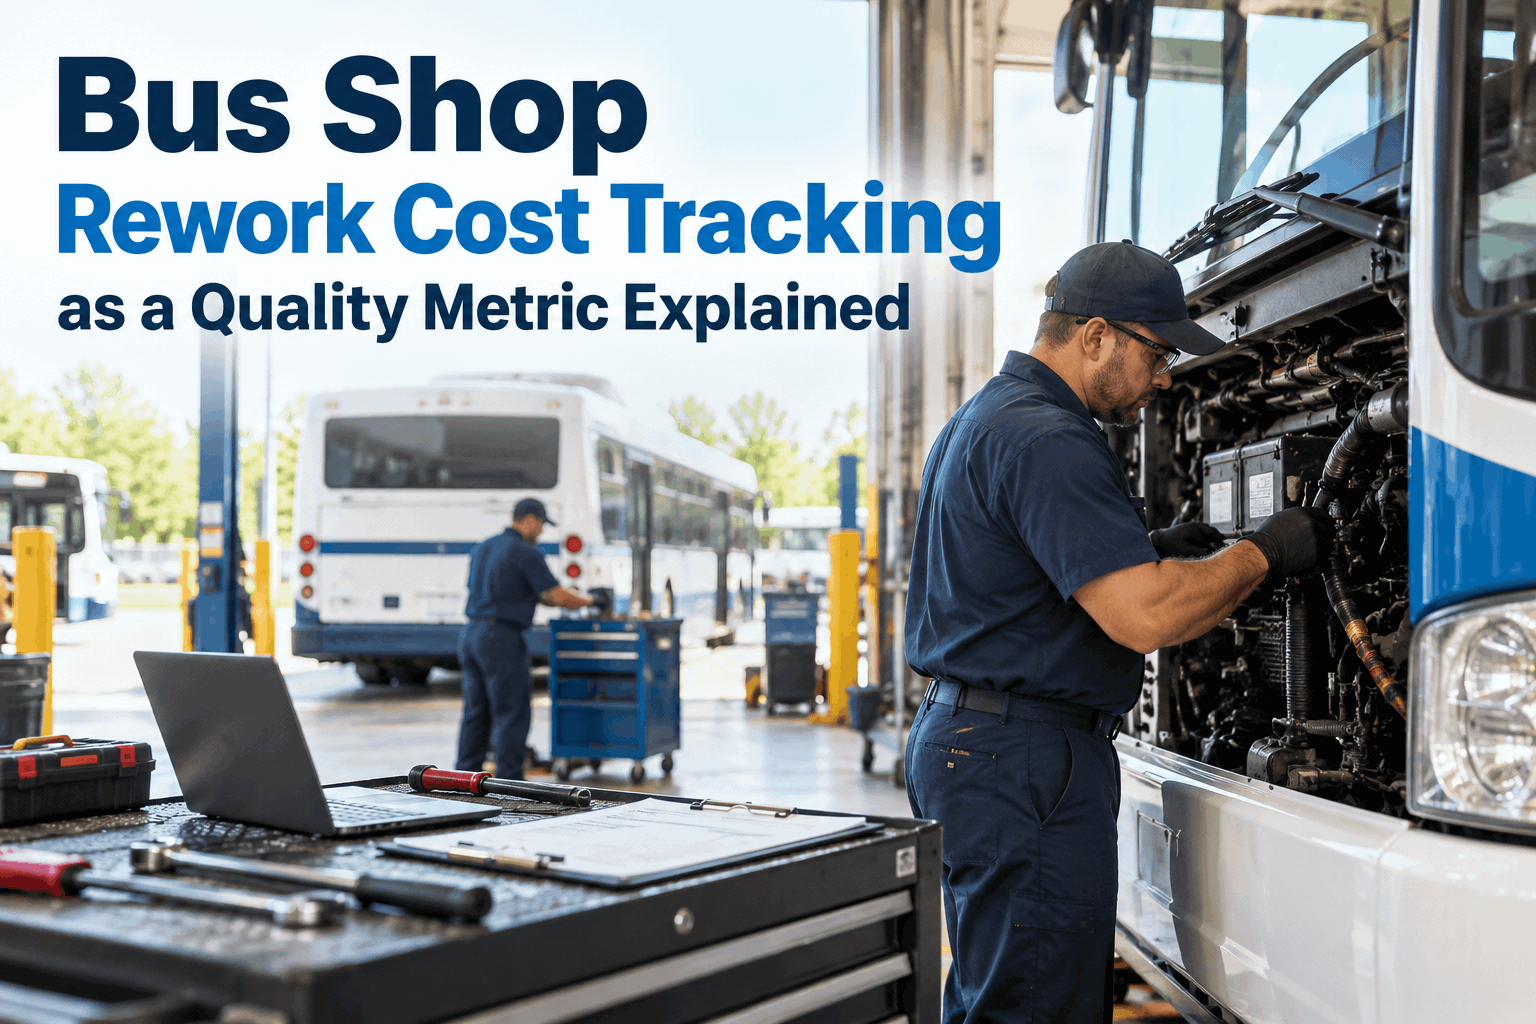
Bus Shop Rework Cost Tracking as a Quality Metric Explained
A repair that comes back costs two to three times getting it right the first time — but most shops never total it. Here's how to track rework cost, read it as a quality metric, and raise your first-time fix rate.
Why Rework Is the Maintenance Cost Nobody Tracks
A comeback hides in plain sight. The first repair closed clean, the bus went back in service, and when it returns it's logged as a fresh job with its own work order. Two separate line items, never summed — so the rework never shows up as rework. It just looks like a busy shop. Meanwhile the real bill is stacking up — a bill you can see itemized on your own data in a demo.
It's logged as two jobs, not one failure
The comeback gets its own work order, so the doubled labor and parts are never totalled against the original repair that didn't hold.
The true cost is more than double labor
Beyond the second repair: the wasted first fix, parts bought twice, a road call if it failed on route, and a bus down when you needed it.
It masks a quality problem
A high comeback rate is a signal — a procedure, a part, or a diagnosis that isn't holding. Untracked, you can't see which, so it keeps happening.
The point of tracking rework isn't to blame techs — it's to see the hidden spend and fix the cause, whether that's a procedure, a part, or a diagnosis that keeps missing.
How to Calculate Your Bus Shop Rework Cost
Start with the comeback rate — the clean quality number — then put dollars on it. A comeback is the same bus, same system, back within a defined window (30 days is the common cutoff) where the first repair didn't hold. Count those, divide by total repairs, and you have your rate.
Then cost it: for each comeback, add the rework labor hours, the parts bought again, and the original repair you wrote off — and you have rework cost in dollars, not just a percentage. A fleet analytics and reporting dashboard does this automatically by linking the comeback work order back to the original.
First-Time Fix Rate: The Quality Metric Behind the Cost
Rework cost is the symptom; first-time fix rate is the cause. It's the share of repairs that hold — the bus goes out and stays out. Every point you raise it is a comeback you didn't have and a rework bill you didn't pay. It's the single number that connects shop quality to the budget.
The gap between 90% and 97% looks small until you price it: at 90%, one in ten repairs comes back at double or triple cost. Closing that gap is where rework tracking pays for itself, and you can start measuring your first-time fix rate free to see where you stand today.
How a Comeback Gets Caught: Same Bus, Same System, 30 Days
The whole metric depends on catching the comeback — and on paper that's exactly what gets missed. Linking the repeat job to the original is what turns two unrelated work orders into one tracked rework event.
That link is the whole game. Once the comeback is tied to the original job, tech, and part, the pattern becomes visible — and you can see the comeback-detection flow on your own data in a demo.
How to Cut Rework Cost and Raise Shop Quality
Once you can see rework, you can attack it. Lowering the comeback rate isn't about rushing techs — it's about fixing the specific causes the data points to. Four moves move the number.
Track the comeback rate by bus, system, and tech
The fleet-wide average hides everything. A 4% average can be a 1.5% shop and a 9% shop — break it down to find where the rework actually lives.
Root-cause the repeat offenders
A system that keeps coming back is a procedure, a part, or a diagnosis that isn't holding. Fix the cause once instead of paying for the comeback every time.
Standardize the fixes that hold
When a repair sticks, capture how it was done so every tech does it the same way. Consistency is what raises the first-time fix rate fleet-wide.
Review rework cost with the numbers, not blame
Bring the data to the team as a shared quality goal. Techs fix what gets measured — and a visible comeback rate makes quality everyone's metric.
Done this way the comeback rate falls and the savings are real — one depot cutting its rate from double digits to under 4% in two quarters is the kind of swing a tracked metric drives. You can walk through the quality dashboard in a demo to see how the breakdown works.
Your Rework Cost Tracking Checklist
These are the habits that turn rework from invisible spend into a managed quality metric. Run them against your own shop.
- Repeat repairs flagged automaticallySame bus, same system, inside 30 days — linked to the original work order, not logged fresh.FOUNDATION
- Rework cost totalled in dollarsRework labor plus parts bought twice plus the wasted first repair — a real number, not a percentage alone.MONTHLY
- First-time fix rate trendedWatch the quality number move toward 97%+ — the trend tells you if changes are working.WEEKLY
- Comeback rate broken out by segmentBy bus, system, and tech — so the average never hides the one place the rework is concentrated.CRITICAL
- Holding fixes documented and standardizedWhen a repair sticks, capture the method so the whole shop repeats what works.ONGOING
- Rework reviewed as quality, not blameBring the numbers to the team as a shared goal — measured quality improves, policed quality hides.ONGOING
A Shop Manager's Take on Tracking Rework
Key Takeaways on Bus Shop Rework Cost Tracking
Bus shop rework cost tracking turns the comebacks you're already paying for into a quality metric you can manage — and it's usually the fastest maintenance savings hiding in plain sight. Four things to take back to the shop.
A comeback costs 2–3x the first fix
Wasted first repair, doubled labor, second parts, road-call risk — it adds up fast.
Rework hides as two separate jobs
Link the repeat work order to the original or the cost stays invisible.
First-time fix rate is the quality metric
Aim for 97%+; comeback rate under 3% is the healthy-shop benchmark.
Break it down, fix the cause
Segment by bus, system, and tech; root-cause the repeat offenders, not the people.
Treat bus shop rework cost tracking as a core quality metric — catch every comeback, total it in dollars, and drive your first-time fix rate up — and you stop paying for the same repair twice. The cheapest repair is the one you do right the first time; rework tracking is how you prove it and protect it. Book a demo and bring last quarter's comebacks.