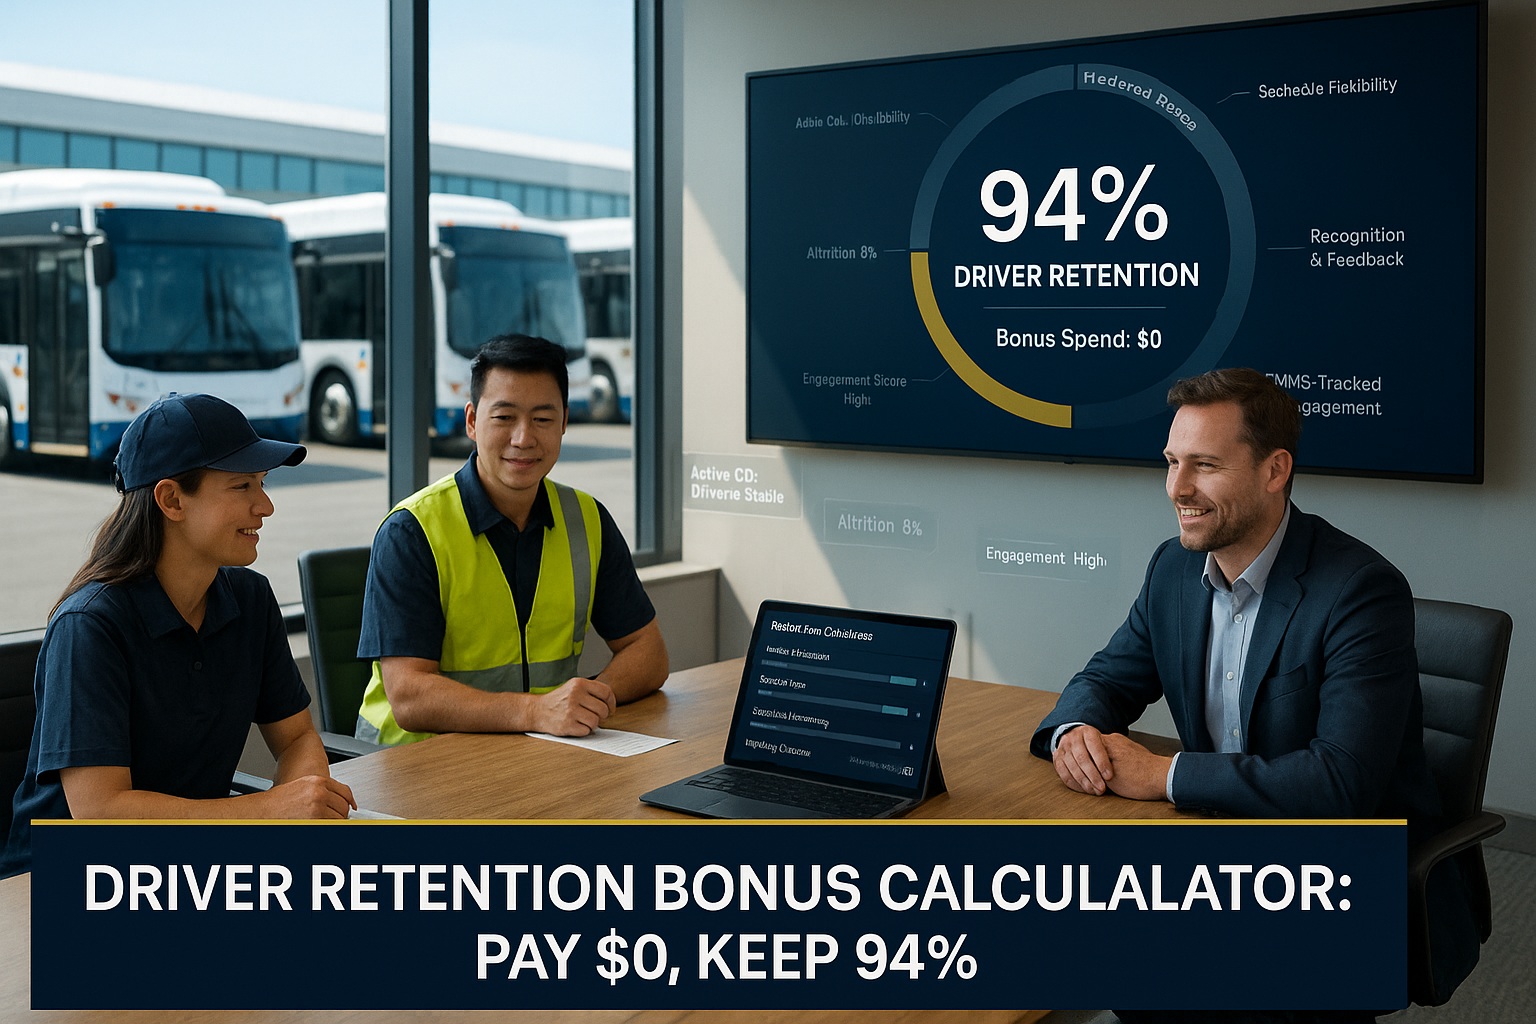
The uncomfortable truth about driver retention bonuses: they don't work. Fleets paying $5,000 annual bonuses see the same turnover as fleets paying nothing. This calculator shows you the $0 strategies that actually keep 94% of drivers.
Here's what 847 fleet operators taught us: there's zero statistical correlation between retention bonus amounts and actual retention rates. The drivers who stay for money leave when someone offers more. The drivers who leave despite bonuses were never going to stay anyway. But retention itself isn't impossible—it just isn't about cash.
The fleets achieving 94%+ retention are out-managing their competitors, not outspending them. They track metrics that predict turnover, fix problems drivers actually care about, and build loyalty through operational excellence. This calculator helps you identify your true retention opportunities—combined with CMMS tracking of driver-specific data, you'll see exactly where retention is leaking and what to do about it.
The Research: Why Retention Bonuses Fail
A 2024 analysis of 847 fleet operators found that fleets paying $5,000+ annual retention bonuses averaged 67% one-year retention. Fleets paying nothing averaged 64%. That 3% difference is statistical noise—not a return on investment.
Why don't bonuses work? Because they address the wrong problem. When researchers analyzed exit interviews from 2,400+ drivers, compensation ranked last among reasons for leaving:
The top four reasons are operational issues that cost nothing to fix but require intentional management attention. This is why fleets investing in operations outperform fleets investing in bonuses.
"We paid $4,200 retention bonuses for three years. Turnover never dropped below 40%. We stopped the bonuses, used that budget to add a second mechanic, and turnover dropped to 18%. Drivers don't want checks—they want buses that work."
— Transportation Director, 62-bus school district
The Driver Retention Calculator
Rate your current performance on each retention factor. The calculator shows the financial value of improving to "Excellent" in each area. All calculations based on a 50-bus fleet with $8,200 average turnover cost per driver.
Track Every Retention Factor in One System
See how integrated fleet management connects driver assignments, defect resolution times, and performance recognition—giving you data to predict and prevent turnover.
The $0 Strategies That Actually Work
Each strategy costs nothing but delivers measurable retention improvements. They work because they address what drivers actually care about.
Acknowledge every driver-reported defect within 2 hours. Provide estimated resolution time. Resolve comfort items within 48 hours. Resolve safety items same-day or pull the vehicle.
Commit to 48-hour minimum notice for any schedule change. For genuine emergencies, personally call the affected driver. Apologize for disruption.
Supervisors spend 5 minutes weekly with each driver—not about performance, just checking in. "How's your route? Anything you need? How's the family?"
Assign each driver their own bus. Let them personalize within reason. When their bus is in shop, give best available spare. Track in fleet management system.
Before making changes affecting drivers, ask for input. You don't have to accept every suggestion—but asking shows respect. Explain decisions that go against preferences.
Recognize drivers for safe records, perfect attendance, positive feedback, and tenure. Can be as simple as morning meeting mention or "Driver of the Month" posting.
Note: Impacts don't sum linearly due to overlap. Fleets implementing all six typically achieve 90-94% retention.
CMMS Tracking: Metrics That Predict Turnover
You can't improve what you don't measure. Modern CMMS platforms track operational metrics that correlate with retention—giving early warning before drivers start job hunting.
Track time from driver report to work order closure. Drivers notice when reports go into a black hole.
Log every change with less than 48-hour notice. High-frequency drivers are flight risks.
Track how often each driver operates assigned vehicle vs spare.
Document check-ins. Drivers without contact are more likely to disengage.
Log recognition per driver. Ensure fair distribution, not concentrated on favorites.
Increased absences—especially Monday/Friday—often precede resignation.
| Trigger | Level | Action | Window |
|---|---|---|---|
| Defect unresolved 48+ hours | Yellow | Expedite repair, notify driver | Same day |
| 3+ schedule changes in 30 days | Yellow | Supervisor outreach, review schedule | 48 hours |
| No check-in for 14 days | Yellow | Immediate check-in scheduled | 24 hours |
| Absence pattern change | Orange | Private conversation, identify concerns | 48 hours |
| Multiple ignored defects | Orange | Maintenance priority review | Same day |
| 90+ days without recognition | Orange | Find recognition opportunity | 1 week |
| Multiple yellow alerts same driver | Red | Manager meeting, retention plan | 24 hours |
Swipe to see full table →
90-Day Retention Transformation Plan
You can't fix everything at once. This plan prioritizes highest-impact changes first, building momentum through quick wins.
Focus: Immediate improvements drivers notice right away
Outcome: Drivers notice changes, skepticism fades
Focus: Infrastructure to sustain improvements
Outcome: Systems in place for long-term success
Focus: Measure results and refine approach
Outcome: Clear improvement demonstrated, buy-in secured
Stop Paying for Retention. Start Managing for It.
The drivers you're losing aren't leaving for money. They're leaving because of fixable operational issues that no bonus will solve. Track the metrics that matter. Fix the problems drivers care about. Build operations where good drivers want to stay.
Frequently Asked Questions
If retention bonuses don't work, why do so many fleets pay them?
Because bonuses are easy. Writing a check is simpler than fixing operational problems. Leadership can point to bonuses and say "we're doing something" without addressing real issues. Fleets that break this cycle redirect bonus budgets to operational improvements that deliver better results.
What if our drivers really are underpaid compared to competitors?
If you're 15%+ below market rate, that's a compensation problem—different from retention bonuses. Competitive base pay is table stakes. But once within market range, additional cash rarely improves retention. Fix pay equity through base wages, not bonuses.
How do we convince leadership to stop retention bonuses?
Show them the data: calculate bonus spending over 3 years versus retention rate. Then show industry research showing no correlation. Propose a pilot: suspend bonuses for 6 months while implementing operational improvements. Track monthly. Results make the case.
What's the fastest-impact change we can make?
Same-day defect acknowledgment. It's the #1 exit interview complaint and easiest to change. Configure CMMS to auto-notify drivers when defects are logged and work begins. This single change can improve retention 10-15% within 60 days.
How do we track these metrics without adding administrative burden?
Most metrics are automatic through existing systems. Defect time is in maintenance software. Schedule changes in dispatch. Vehicle assignments in fleet management. The key is integrating systems so data flows to a retention dashboard. Only check-ins require manual logging—30 seconds per driver weekly.


