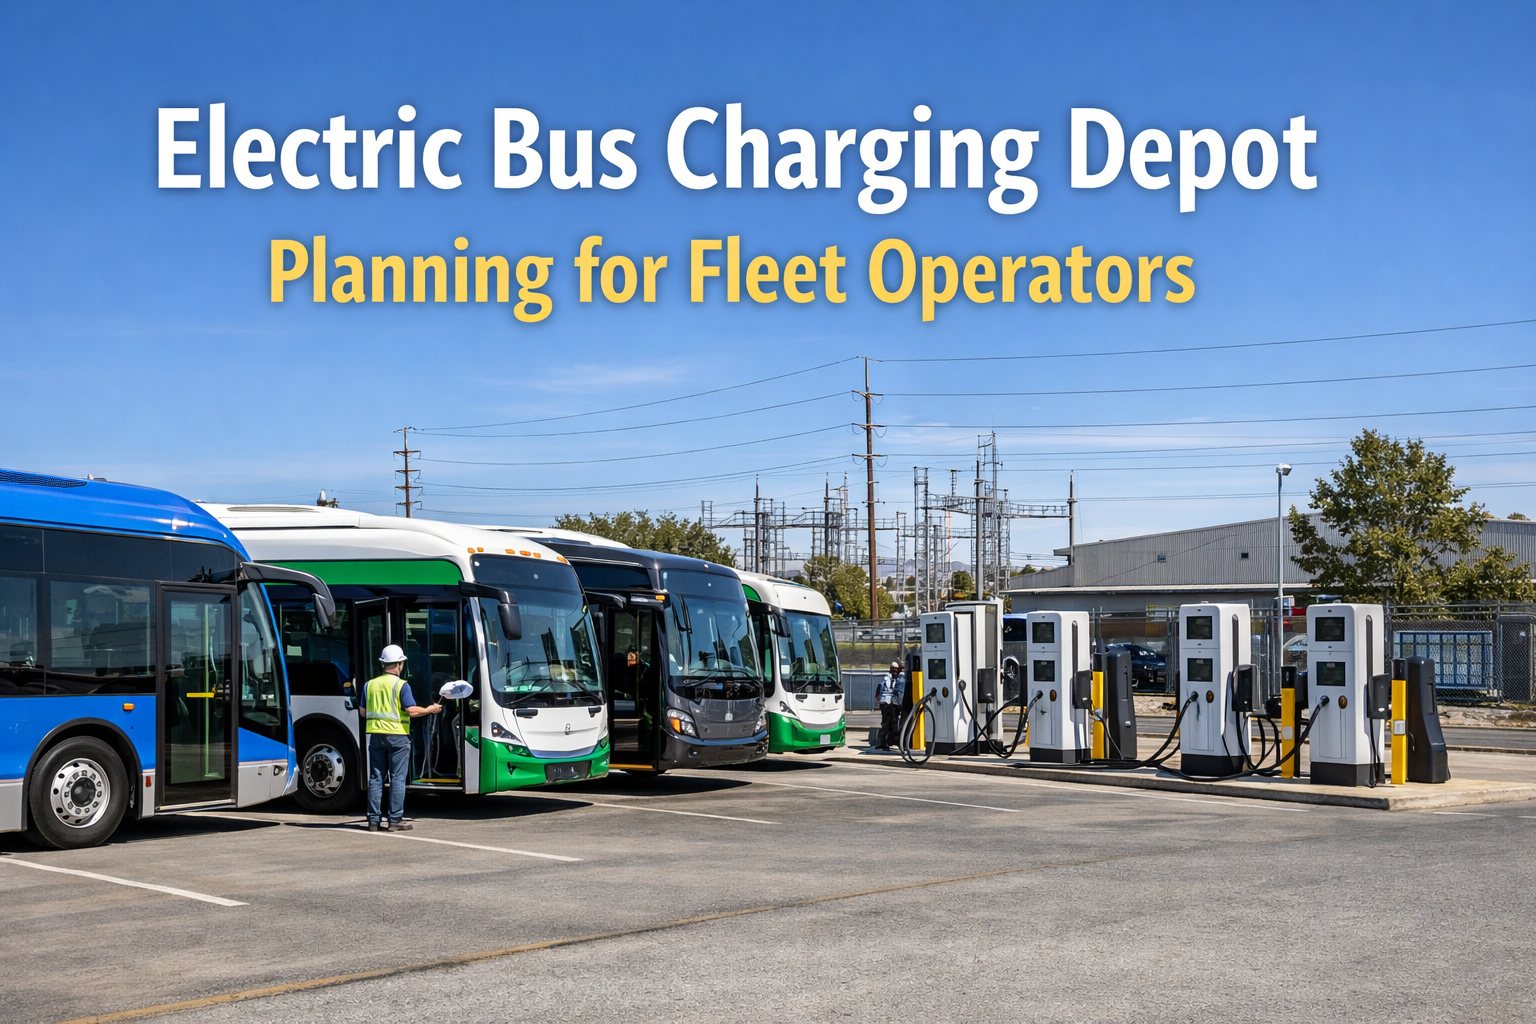
Getting electric bus depot charging wrong costs operators between $500,000 and $2 million—grid upgrade rework, delayed deployments and demand charge penalties that nobody budgeted for. Without a proper charging plan, one diesel bus might require two electric buses to operate the same service, doubling your fleet costs before you've even started. This guide covers everything fleet operators need to plan an electric bus charging depot correctly: charger types matched to your routes, depot layouts that maximize overnight windows, energy management that cuts electricity costs by 20-35%, and maintenance systems that treat every charger as mission-critical infrastructure.
Charger Types: Matching Power to Your Routes
Choosing the wrong charger type is one of the most expensive mistakes fleets make. The decision depends on your route profiles, overnight dwell time, and whether you need opportunity charging during the day.
Fast chargers (150-350 kW) now represent 60% of new installations, driven by buses with 300+ kWh batteries needing quick turnaround. But higher power means higher demand charges. Sign up for BusCMMS to track charger utilization and optimize your infrastructure investment.
Depot vs. Opportunity Charging: Choose Your Strategy
Your charging strategy fundamentally shapes your entire depot design. Most successful fleets use a combination—overnight depot charging for the bulk of energy, with opportunity charging for extended routes.
Urban buses with predictable routes often succeed with overnight-only charging. Suburban and regional routes benefit from combining both strategies. Book a demo to see how BusCMMS helps plan your optimal charging strategy.
Grid Capacity: The Math That Matters
Underestimating grid capacity is the #1 cause of depot delays and cost overruns. Calculate your true power requirements before signing any utility agreements.
A Washington state study found that starting with higher State of Charge (40% vs 10%) reduced infrastructure costs by over 90%—proof that route planning and charging strategy are inseparable. Start tracking your fleet's energy consumption patterns to optimize depot sizing.
Smart Charging: Cut Energy Costs by 20-35%
The biggest ongoing cost isn't equipment—it's electricity. Smart charging management can slash your energy bills by shifting load to off-peak hours and avoiding demand charge spikes.
Smart charging systems integrate with your fleet schedule, ensuring buses are ready for morning pullout while charging during the cheapest hours. Schedule a demo to see smart load management in action.
Expert Review: Charger Maintenance as Mission-Critical
A broken charger doesn't just sit there—it creates a cascade: buses can't charge, routes get cancelled, passengers are stranded. Treating chargers as mission-critical infrastructure requires the same preventive maintenance discipline you apply to your buses.
Fleet operators using connected charger diagnostics report 40% reductions in emergency repair costs and 90%+ maintenance compliance within the first year. Sign up to add charger maintenance to your fleet CMMS.
Depot Layout: Design for Efficiency
Your charging bay layout affects everything from queuing delays to cable wear. Plan for how buses actually move through the depot—not just where they park.
Frequently Asked Questions
How much does electric bus charging depot infrastructure cost?
Infrastructure costs vary significantly by charger type and site conditions. Level 2 chargers run $2,000-$5,000 for equipment plus $1,000-$10,000 installation. Mid-power DC fast chargers (50-150 kW) cost $15,000-$50,000 equipment plus $20,000-$50,000 installation. High-power DC chargers (150-350 kW) can reach $50,000-$140,000 for equipment alone, with installation adding another $50,000-$100,000. Grid upgrades—transformers, distribution lines, service panels—often exceed $500,000 for larger depots. Plan for 20% contingency on all estimates.
Should I choose depot charging or opportunity charging?
Most fleets benefit from primarily depot charging (82% of global infrastructure uses this approach) supplemented by opportunity charging for extended routes. Depot charging during overnight hours leverages off-peak electricity rates—potentially saving up to 77% versus peak rates. Opportunity charging (on-route fast charging) enables smaller batteries and longer daily ranges but increases infrastructure complexity and electricity costs. Urban routes with predictable schedules and 8+ hour overnight dwell typically succeed with depot-only strategies.
How do I calculate grid capacity for an electric bus depot?
Start with: Fleet Size × Charger Power × Simultaneity Factor × Growth Buffer. For example, 50 buses × 50 kW chargers × 0.7 simultaneity (not all charge simultaneously) × 1.2 (20% growth buffer) = 2.1 MW. Engage your utility early—transformer upgrades require 6-18 months lead time. Distribution line extensions can cost $100,000+ per mile. Right-sizing your grid connection now costs 2-3× less than retrofitting later.
How can smart charging reduce my electricity costs?
Smart charging management delivers 20-35% energy cost reductions through several strategies. Shifting all charging to off-peak hours (typically 10pm-6am) can reduce energy costs by up to 77%. Load balancing flattens demand peaks, reducing demand charges by 17% or more. Behind-the-meter solar and battery storage can achieve 35%+ annual utility savings. Time-of-use rate optimization adds another 12%. Smart systems integrate with your fleet schedule to ensure buses are ready for morning pullout while maximizing savings.
What maintenance do electric bus chargers require?
Treat chargers as mission-critical infrastructure. Daily: visual inspection, cable/connector checks, fault code review. Weekly: clean connectors, verify ventilation and cooling, check software updates. Monthly: full electrical inspection, test emergency shutoffs, calibration verification. Annually: professional electrical audit, thermal imaging scan, and full system certification. Fleet operators using connected charger diagnostics report 40% reductions in emergency repair costs and 90%+ maintenance compliance within the first year.







