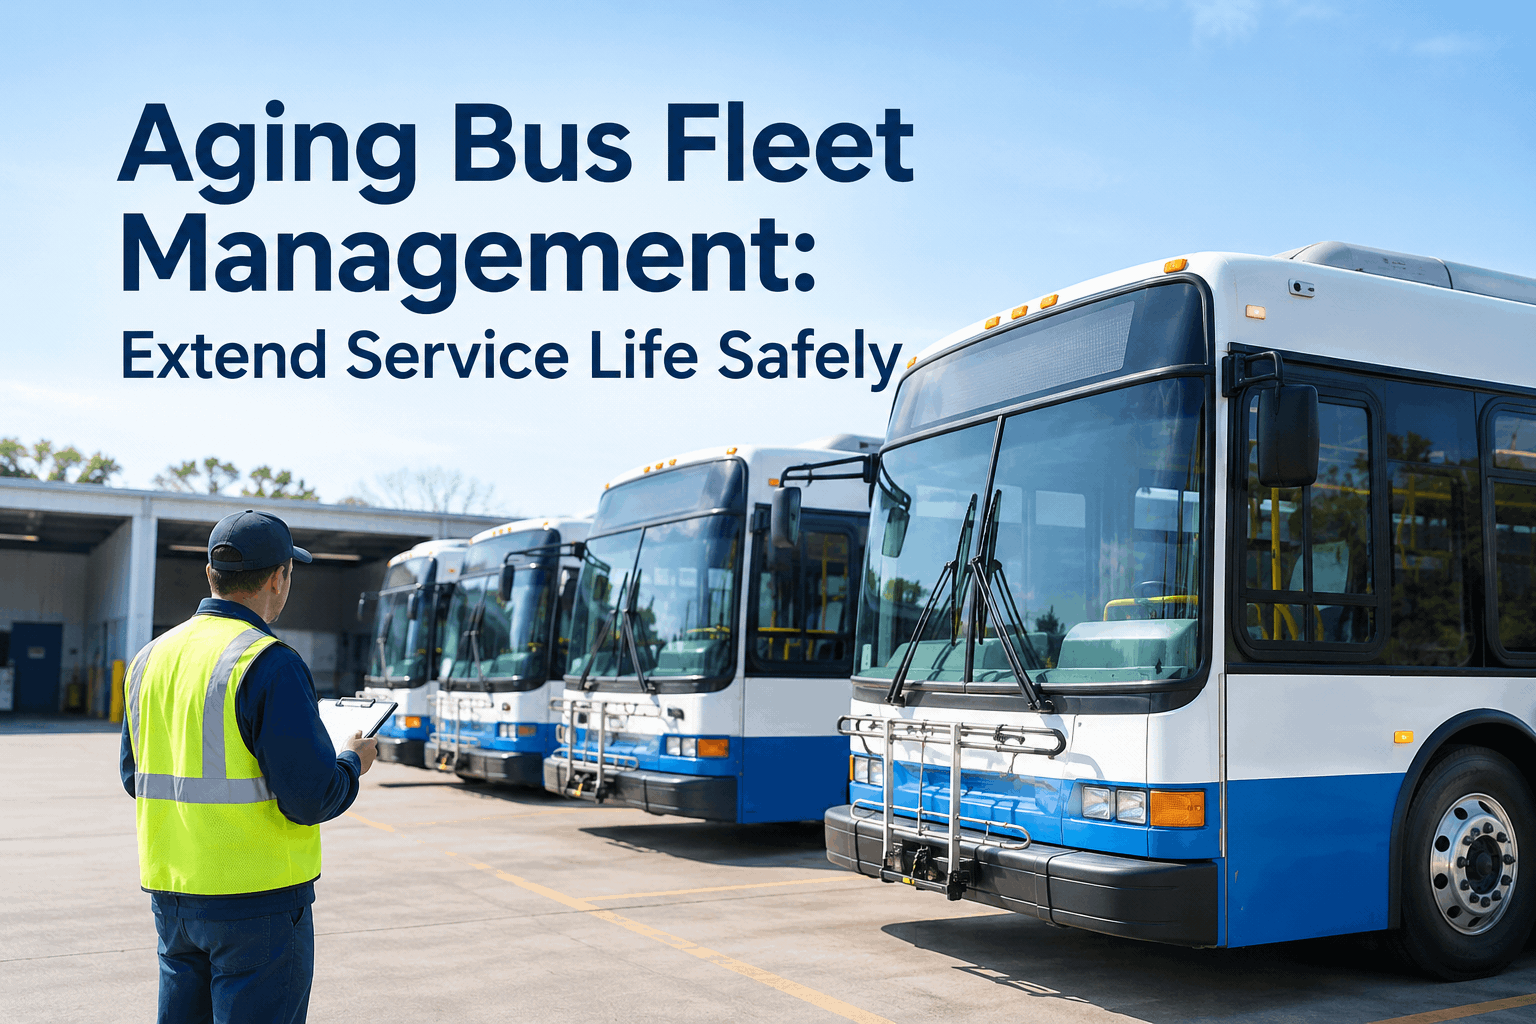
Half your fleet just crossed the twelve-year mark, the replacement buses are three budget cycles away, and ridership did not slow down to wait. The real question is not when they retire — it is how you run them a few more years without a reliability collapse or a safety scare. That is aging bus fleet management: a strategy to extend bus service life safely. You can see how an aging fleet is kept safe and road-ready in a demo.
Aging Bus Fleet Management: How to Extend Service Life Safely
An aging bus is not a cliff — it is a rising cost-per-mile curve you manage. Here is the strategy for running buses past their useful-life benchmark safely, with the preventive maintenance, inspections, and records that keep an old fleet dependable.
Illustrative curve. The FTA minimum useful-life benchmark for a heavy-duty transit bus is 12 years or 500,000 miles; the goal is to flatten the climb, not pretend it does not happen.
Why an Aging Bus Fleet Is a Strategy Problem, Not a Write-Off
The FTA useful-life benchmark — 12 years or 500,000 miles for a heavy-duty transit bus — is a planning marker, not an expiration date. Buses do not fail the morning they cross it. What actually happens is that a neglected fleet gets dangerous and expensive around that age, and a well-managed one keeps running dependably well past it. The difference is entirely in how you maintain and track the fleet as it ages.
An aging fleet shows up in your FTA Transit Asset Management report as the share of buses past their useful-life benchmark — a number leadership watches, and one you manage with maintenance, not hope.
The agencies that run old buses well treat that number as something to work down with disciplined upkeep — you can walk through how the lifecycle record supports that in a demo.
The Lifecycle Stages of a Bus — and the Maintenance Posture Each Needs
A bus does not need the same care at year two as it does at year thirteen. Aging bus fleet management means matching your maintenance intensity to the stage each vehicle is in — lighter early, tighter and more watchful as it ages. Here is how the posture shifts across the lifecycle.
Swipe sideways to see all columns
The shift from a fixed OEM schedule to a data-driven, tightening one is the whole game for an aging fleet. A bus-built maintenance system makes that shift visible — it knows which stage each bus is in and adjusts the plan. Book a demo to see stage-based PM scheduling on your own buses.
What Rises as a Bus Ages — the Signals to Track
Extending service life safely means watching the right numbers climb and acting before they spike. Four signals tell you whether an aging bus is being managed or quietly becoming a liability.
Cost per mile
The clearest lifecycle signal. When an aging bus's cost per mile approaches what a new-bus payment would be, the math is shifting.
Road calls + breakdowns
Rising in-service failures are the first thing riders and drivers feel. A climbing road-call rate on one bus flags it for a harder look.
Availability drag
An aging bus that spends more days in the shop pulls down fleet availability — the metric that decides whether routes run.
Repeat safety defects
The same safety-critical fault returning is the hard line. Repeat brake, steering, or structural issues move a bus toward retirement fast.
None of these is visible without per-vehicle tracking — which is exactly where a spreadsheet fails an aging fleet. Start free and track cost-per-mile and road calls per bus.
Where Extending Service Life Stops Being Smart
Keeping a bus running is the goal — until it is not. Extending service life has a line, and crossing it quietly is how agencies end up pouring money into a bus that should have been retired. These are the signals that a specific bus has reached the end of safe, economical life.
Keep running when…
- Cost per mile is stable and well under a new-bus payment
- Safety-critical systems pass cleanly, no repeat defects
- The bus holds availability and meets its route reliably
- PM is current and the maintenance record is clean
Move toward retirement when…
- Cost per mile rivals or exceeds a replacement payment
- The same safety-critical fault keeps coming back
- Shop days are dragging down fleet availability
- Structural or frame corrosion appears — a hard stop
Safety is never a cost trade-off. A repeat safety-critical defect or structural corrosion retires a bus regardless of what the cost math says.
The honest extend-or-retire call needs the data in front of you — cost-per-mile trend, defect history, availability — per bus. See the per-bus data behind an extend-or-retire decision in a demo.
The Aging-Fleet Maintenance Strategy Checklist
Run this against your fleet. Each item is a piece of a real extend-service-life strategy — and the ones you cannot check are where an aging bus becomes a risk instead of an asset.
- PM intervals tighten as buses ageOlder buses are on shorter, data-driven PM cycles, not the same schedule as a new one.CRITICAL
- Safety-critical systems inspected harderBrakes, steering, suspension, and structure get closer attention on an aging bus.CRITICAL
- Cost per mile tracked per busYou can see which aging buses are getting expensive and which are still earning their keep.CRITICAL
- Repeat defects flagged automaticallyThe same fault returning on a bus is surfaced from its history, not left to a tech's memory.FOUNDATION
- Per-vehicle lifecycle record keptA full maintenance history per bus, supporting both the keep-running call and TAM reporting.FOUNDATION
- Extend-or-retire reviewed each cycleEvery aging bus is checked against the retire signals on a schedule, not only when it fails.FOUNDATION
If the critical items are not tracked, you are not extending service life — you are gambling on it. Start free and get every item on this list in one system.
How BusCMMS Manages an Aging Bus Fleet
Extending service life safely is a tracking-and-discipline problem, which is what a bus-built CMMS is for. BusCMMS makes the aging-fleet strategy something you run and prove, not something you intend to get to.
Stage-based PM scheduling
Tighten preventive maintenance intervals as a bus ages, by mileage or time, so an older fleet gets the closer care it needs.
Cost-per-mile + reliability dashboards
See cost per mile, road calls, and availability per bus, so the extend-or-retire call is a number, not a hunch.
Lifecycle records + TAM support
A full per-vehicle maintenance history that documents the keep-running decision and feeds your Transit Asset Management reporting.
It runs the same whether your fleet is young or mostly past its benchmark, so the strategy scales with the fleet you actually have. You can book a demo and bring your oldest buses to see them mapped on the lifecycle.
A Transit Maintenance Director's Take
Our capital budget does not care that I have eleven buses past their benchmark — they still have to run routes safely. What changed for us was tracking cost-per-mile and defect history on every one of those old buses. Now I can walk into a board meeting and show exactly which three are still cheap to run and which two are telling me it is time. We have kept most of them in safe service three extra years, and I can prove every mile of it. That is the whole job with an old fleet.
Key Takeaways on Aging Bus Fleet Management
Aging is a strategy, not a cliff
The FTA benchmark is a marker; a well-maintained old bus beats a neglected new one.
Match maintenance to lifecycle stage
Lighter when new, tighter and more watchful as a bus moves past its benchmark.
Track the rising signals per bus
Cost per mile, road calls, availability, and repeat defects tell you when to act.
Safety is never a cost trade
A repeat safety defect or structural corrosion retires a bus, whatever the budget says.
Treat aging bus fleet management as a deliberate extend-service-life strategy — stage-based maintenance, tracked signals, honest retire lines, and a per-vehicle record — and an old fleet stays safe, dependable, and defensible to leadership. The buses will age no matter what; whether that costs you a safety scare or buys you three good extra years is a matter of how you manage it.