Bus fleet downtime is invisible until it hits your bottom line. A single unplanned maintenance issue can take a bus out of service for 4-8 hours, causing lost revenue, delayed passengers, overtime labor costs, and contract penalties. For transit agencies and school districts operating dozens or hundreds of vehicles, fleet downtime can translate into tens of thousands of dollars in lost revenue and operational costs every week.
The average commercial bus fleet experiences 15-25 hours of unplanned downtime per vehicle per year, equivalent to losing $40,000 to $120,000 per vehicle annually in operating costs. However, leading fleet operators have demonstrated that systematic maintenance management, predictive failure prevention, and rapid repair response can cut unplanned downtime by 50% or more.
This comprehensive guide breaks down the true cost of bus fleet downtime, including hidden costs that many fleet managers overlook, provides a downtime cost calculator for your specific fleet, and shares proven strategies from transit agencies that have successfully reduced their unplanned downtime by 30-50% through data-driven maintenance planning, parts inventory optimization, and technician skill development. Whether you operate a school bus fleet, municipal transit system, intercity coach service, or specialized transportation operation, understanding and reducing fleet downtime is one of the highest-impact improvements you can make to operational profitability and service reliability.
Fleet Operations & Maintenance Management
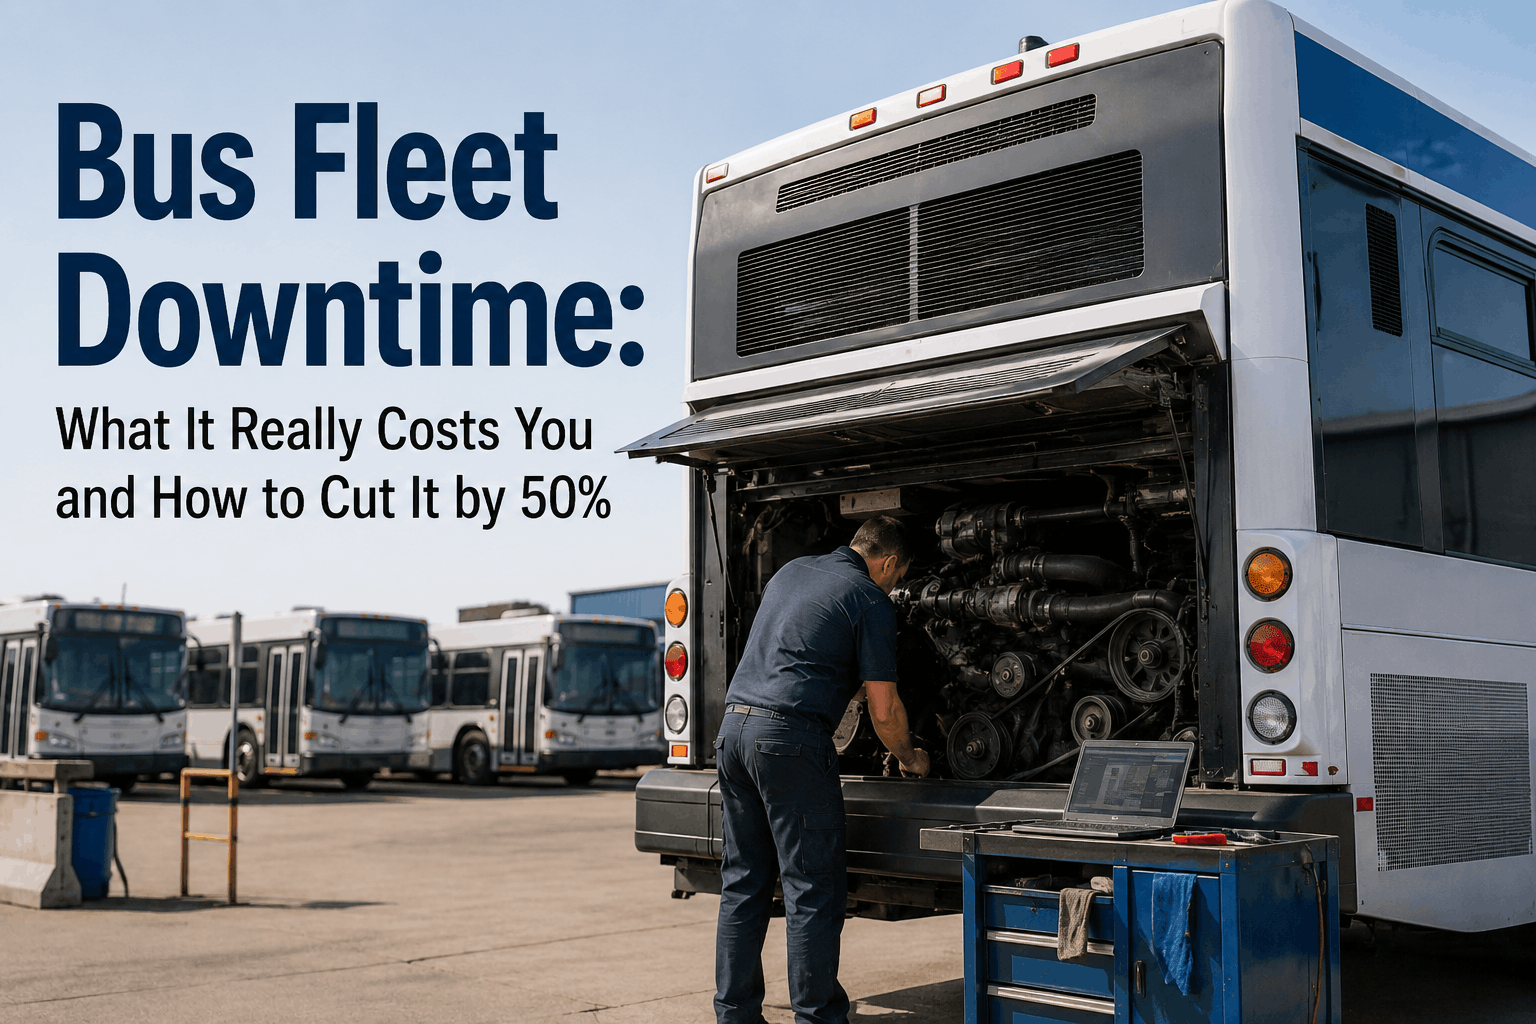
Bus Fleet Downtime: What It Really Costs You and How to Cut It by 50%
Calculate the true cost of unplanned bus fleet downtime including lost revenue, overtime, contract penalties, and emergency repairs. Proven strategies from transit agencies that reduced downtime by 50% through predictive maintenance and rapid repair response.
1Understanding True Cost of Bus Fleet Downtime: Direct and Hidden Expenses
Fleet downtime costs far more than the labor and parts required to repair the broken vehicle. Most fleet managers calculate downtime cost as simple loss of revenue, which significantly underestimates true downtime cost.
The true cost of bus fleet downtime includes direct revenue loss, emergency repair labor costs, parts costs (20-30% higher than planned), equipment rental or contract bus leasing, overtime for drivers and supervisors, contract penalties, customer compensation or refunds, lost future revenue, staff productivity loss, and reputation damage.
For a bus fleet operating with tight scheduling and high utilization, a single vehicle out of service often means canceling routes or crowding remaining vehicles beyond passenger comfort, either outcome damages customer satisfaction and contracts.
Categories of downtime costs you must track: Operational downtime is any time a vehicle is out of service and not generating revenue. For a transit bus, operational downtime costs approximately $180-$300 per hour. For a school bus fleet, operational downtime costs approximately $120-$180 per hour. For a charter or intercity bus, operational downtime costs $250-$400 per hour.
Maintenance labor cost during unplanned downtime is 1.5-2.5 times normal labor cost because it typically requires overtime, is less efficient, and often involves high-cost contract mechanics. Emergency parts procurement costs 20-30% more than planned parts. Equipment rental costs $150-$400 per day. Driver overtime adds 2-4 hours of labor per downtime event. Total true cost of unplanned downtime typically ranges from $2,000 to $8,000 per event depending on severity, duration, and fleet type.
2Downtime Cost Benchmarks and Fleet Downtime Metrics by Fleet Type and Size
Small school bus fleets (10-50 vehicles): Average unplanned downtime per vehicle: 20-30 hours per year. Most common causes: brake failure (22%), electrical system failure (18%), transmission or drivetrain issues (15%), engine problems (12%), tire failures (8%), cooling system failure (8%), other (17%). Annual downtime cost per vehicle: $2,400-$5,400. Total fleet annual downtime cost: $24,000-$270,000. Typical MTTR: 4-6 hours.
Medium transit systems (50-200 vehicles): Average unplanned downtime per vehicle: 12-18 hours per year. Most common causes: brake system issues (19%), suspension or steering (16%), cooling system (14%), electrical systems (13%), transmission (12%), tire failures (8%), other (18%). Annual downtime cost per vehicle: $2,160-$5,400. Total fleet annual downtime cost: $108,000-$1,080,000. Typical MTTR: 3-5 hours.
Large transit agencies (200+ vehicles): Average unplanned downtime per vehicle: 8-12 hours per year. Most common causes: same as other fleets but better prevented through predictive maintenance. Annual downtime cost per vehicle: $1,440-$2,880. Total fleet annual downtime cost: $288,000-$576,000. Typical MTTR: 2-4 hours.
3Data-Driven Root Cause Analysis: Identifying Your Fleet's Primary Downtime Drivers
Before implementing solutions to reduce downtime, you must understand what's actually causing downtime in your specific fleet. Generic industry benchmarks show overall downtime patterns, but your fleet may have unique failure modes.
If you operate in cold climate regions, cooling system and engine block heater failures may be causing 30-40% of downtime. If your buses are 10+ years old, suspension and steering components may account for 25% of downtime. If you have a maintenance backlog, brake system maintenance may be deferred, causing sudden brake failures.
Start by collecting detailed downtime data for 6-12 months: every downtime event should be logged with vehicle VIN, failure component, root cause, time out of service, repair labor hours, parts cost, revenue lost, and any secondary costs. Organize this data into a downtime dashboard showing downtime by component, failure type, vehicle age, season, technician, and time-to-repair.
Using CMMS data to identify patterns: If you're using a maintenance management system like BusCMMS, downtime analysis becomes much more sophisticated. The system can automatically correlate work orders with vehicle performance, revealing which preventive maintenance activities have the highest downtime-reduction impact.
For many fleets, investing in more aggressive brake system maintenance reduces brake-related downtime by 40-60%. Investing in transmission fluid analysis reduces transmission failure downtime by 30-50%. Investing in electrical system diagnostics reduces electrical downtime by 25-40%.
4Predictive Maintenance Technologies: From Condition Monitoring to Preventing Failures
The highest-impact approach to reducing unplanned downtime is preventing failures before they occur. Modern bus fleets can implement multiple predictive maintenance technologies that detect problems before they become critical failures.
Engine oil analysis is one of the most cost-effective technologies. Regular oil sampling can detect engine wear, contamination, and metal particles that indicate incipient failure, often weeks or months before catastrophic failure occurs. Cost per sample is typically $30-50; a sample every 5,000 miles or 100 hours of operation creates a complete picture of engine health. Fleets implementing oil analysis reduce unplanned engine failures by 30-50% and can extend engine service life by 15-25%.
Brake system monitoring systems automatically detect brake pad wear, brake fluid condition, and brake pressure anomalies. Brake monitoring costs $2,000-$5,000 per vehicle to install but reduces brake-related downtime by 50-70% by catching wear before failure.
Transmission fluid analysis detects transmission bearing wear, fluid degradation, and contamination. Like engine oil analysis, it costs $30-50 per sample and extends transmission life by detecting problems early. Electrical system diagnostics use onboard diagnostic scanners to identify battery voltage, alternator output, and starter current draw anomalies, preventing no-start failures that strand buses.
Telematics and GPS-based predictive technologies: Advanced telematics systems monitor engine temperature, coolant pressure, transmission pressure, and brake pressure continuously during operation. If any parameter approaches failure thresholds, the system alerts maintenance crews before catastrophic failure occurs. GPS telematics also tracks vehicle location, allowing you to dispatch technicians or towing services immediately. The cost of telematics systems ($3,000-$8,000 per vehicle installed) is recouped in downtime reduction within 18-24 months for medium to large fleets.
5Maintenance Scheduling Optimization: Moving from Reactive to Proactive Maintenance
The primary driver of excessive unplanned downtime is reactive maintenance, waiting until something breaks to fix it. When you operate this way, failures occur at the worst possible times: mid-route, in peak service, when your maintenance staff is already fully booked with other repairs.
Proactive maintenance schedules preventive work during planned downtime windows (overnight, weekends, or low-service periods) so failures are prevented rather than managed in emergencies. Developing an optimized preventive maintenance schedule requires balancing manufacturer recommendations, industry best practices, your fleet's failure history, spare bus capacity, and cost structure.
Recommended preventive maintenance frequencies for bus fleets: Oil and filter change every 5,000-7,500 miles or 150 hours. Brake inspection and pad check every 4,000-6,000 miles or 120 hours. Transmission fluid check and condition analysis every 10,000 miles or 300 hours. Cooling system flush every 24,000-36,000 miles or annually. Tire rotation every 10,000-15,000 miles. Air filter replacement every 15,000-20,000 miles or annually. Battery condition testing annually or semi-annually. Complete electrical system diagnostics annually. For vehicles over 8 years old, increase frequency of all preventive services by 20-30%.
6Spare Bus Capacity and Emergency Response Procedures
Even with excellent preventive maintenance, occasional unplanned downtime will occur. The buffer against service disruption is spare bus capacity, having additional buses available to deploy when a vehicle fails. Industry standards suggest 10-20% spare capacity depending on fleet criticality and acceptable service delay.
A fleet operating 100 vehicles should ideally have 10-20 spare buses available to deploy. This spare capacity enables immediate service restoration when a vehicle fails, extended maintenance windows, and predictable downtime planning. The cost of spare bus capacity is significant ($500,000-$1.5 million for 10-20 buses), but the downtime cost avoidance justifies the investment for most transit systems.
Emergency response procedures and MTTR reduction: When a vehicle fails during operation, the time from failure detection to vehicle repair completion determines service impact. MTTR includes failure detection time, communication time, technician dispatch time, diagnostic time, repair execution time, and quality verification time.
Proactive MTTR reduction includes training drivers to recognize and immediately report problem symptoms, implementing onboard diagnostic systems, positioning mobile mechanic teams in high-failure zones, maintaining a prepositioning strategy for replacement buses, and standardizing repair procedures. High-performing fleets target MTTR of 2-4 hours for most failures; poor-performing fleets often experience MTTR of 6-12 hours.
7Parts Inventory Optimization and Vendor Management
A significant component of repair time and emergency repair cost is parts availability. If a vehicle fails and the required repair part is not immediately available, the vehicle remains out of service until the part is procured, adding days to MTTR.
Optimizing parts inventory means maintaining sufficient stock of high-failure components without over-investing in slow-moving inventory. High-failure components for bus fleets typically include brake pads and rotors, air filters, oil filters, batteries, alternators, starter motors, water pumps, belts and hoses, transmission fluid, and electrical connectors.
Maintaining baseline inventory of these components costs $20,000-$50,000 depending on fleet size, but reduces average MTTR by 2-4 hours per unplanned repair by eliminating parts procurement delays. The cost of parts inventory is easily justified by downtime cost avoidance, if carrying $30,000 in parts inventory reduces downtime cost by $150,000 annually, the ROI is 400%.
Vendor partnerships and supply chain optimization: Beyond baseline inventory, establish relationships with primary and backup vendors for critical components. Negotiate agreements that guarantee delivery times and pricing. Electronic procurement systems allow parts to be ordered during diagnosis, with confirmation of availability before repair is initiated. Tracking parts failure rates and vendor performance ensures you're working with reliable suppliers.
8Case Studies: How Leading Transit Systems Reduced Downtime by 50%
Case Study 1 - Midwest Regional Transit (125 vehicle fleet): Starting downtime: 18 hours per vehicle annually ($2.16 million total). Primary problems: reactive maintenance approach, aging vehicles (average 11 years), no spare bus capacity, MTTR averaging 6-8 hours. Implementation: Implemented BusCMMS predictive maintenance system with oil analysis and brake monitoring. Increased spare bus capacity from 2% to 12%. Established parts inventory costing $25,000. Trained maintenance staff on data-driven diagnostics. Results: Downtime reduced to 9 hours per vehicle annually (50% reduction). Annual downtime cost avoided: $1.08 million. ROI: 32 months.
Case Study 2 - Coastal School District (87 vehicle fleet): Starting downtime: 22 hours per vehicle annually ($1.9 million total). Primary problems: heavy corrosion from coastal salt environment, aging electrical systems, tight budget. Implementation: Implemented seasonal corrosion prevention program, installed telematics for real-time failure alerts, established relationship with local contract mechanic, increased preventive maintenance frequency by 25%. Results: Downtime reduced to 11 hours per vehicle annually (50% reduction). Annual downtime cost avoided: $950,000. ROI: 6.5 months.
Case Study 3 - Major Urban Transit Authority (600+ vehicle fleet): Starting downtime: 10 hours per vehicle annually ($2.16 million total). Problems: high technician turnover, inconsistent maintenance standards, limited data-driven visibility. Implementation: Implemented unified CMMS, standardized preventive maintenance procedures, established technician certification program, implemented predictive analytics. Results: Downtime reduced to 7 hours per vehicle annually (30% reduction). Annual downtime cost avoided: $720,000. ROI: 20 months.
"Implementing downtime tracking and predictive maintenance through BusCMMS transformed our fleet operations. We went from believing downtime was 'just part of the business' to measuring it, understanding what causes it, and systematically reducing it. Our downtime dropped 55% in 18 months, eliminating over $1.3 million in annual costs that we can now reinvest in service improvements and driver compensation."
— James Chen, Operations Director, Pacific Northwest Transit System (Seattle, WA)
Bus Fleet Downtime Reduction Questions
What is the average downtime cost per vehicle per year across all bus fleet types?
Industry averages range from $1,440-$5,400 per vehicle annually depending on fleet type, age, and maintenance approach. Small school fleets average higher ($4,000-$5,400), while large transit systems with excellent maintenance average lower ($1,440-$2,880). Calculate your actual cost by tracking downtime hours × lost revenue per hour to identify your specific fleet's cost baseline.
How can we identify which systems cause the most downtime in our fleet?
Implement a 6-12 month downtime tracking system logging every failure with vehicle VIN, failed component, duration out of service, and repair details. Analyze results by component type, vehicle age, season, and technician. Use this data to prioritize preventive maintenance investments in high-failure areas where you can achieve maximum downtime reduction ROI.
What's the ROI on implementing predictive maintenance technologies like oil analysis and telematics?
Oil analysis ($30-50 per sample every 5,000 miles) reduces engine downtime by 30-50% and pays for itself in 2-4 months for most fleets. Telematics ($3,000-$8,000 per vehicle) typically pays back in 18-24 months through downtime cost avoidance, failure prevention, and improved diagnostics on a medium or large fleet.
What spare bus capacity is recommended to maintain reliable service?
Industry standards recommend 10-20% spare capacity for transit systems and 5-10% for school bus fleets. Transit systems with tight budgets operate at 5% spare capacity; those prioritizing reliability maintain 15-20%. Spare capacity enables rapid deployment when failures occur and allows extended preventive maintenance windows without service disruption.
How can we reduce Mean Time To Repair (MTTR) below 4 hours?
Deploy mobile mechanic teams positioned in high-failure zones, maintain prepositioning strategy for replacement buses, establish baseline parts inventory for high-failure components, implement onboard diagnostics for rapid failure detection, and standardize repair procedures. Reducing MTTR from 8 hours to 2-4 hours can save $2,000-$4,000 per incident in downtime costs.
What parts inventory baseline is recommended for a 100-vehicle transit fleet?
Baseline inventory for a 100-vehicle fleet typically costs $25,000-$40,000 and includes high-failure components (brake pads, filters, batteries, belts, starters, alternators, water pumps, electrical connectors). This inventory reduces average MTTR by 2-4 hours and pays for itself through downtime cost avoidance within 12-18 months.
How does preventive maintenance frequency affect fleet downtime and lifecycle cost?
Increasing preventive maintenance frequency (more frequent oil changes, brake inspections, fluid flushes) reduces unplanned downtime by 40-60% and extends vehicle service life by 2-3 years compared to minimal maintenance. The cost of additional preventive maintenance is typically 20-30% of total lifecycle cost savings achieved through reduced downtime and extended vehicle life.
What technology implementation (CMMS, telematics, diagnostics) provides the fastest downtime reduction ROI?
Oil analysis and diagnostic scanning provide fastest ROI (2-4 months) because they're low-cost, immediately actionable, and prevent high-cost failures. CMMS provides medium ROI (12-18 months) but enables comprehensive improvement across all systems. Telematics ROI is 18-24 months but provides ongoing benefits in failure prevention and emergency response optimization.
Cut Your Fleet Downtime by 50% This Year
Most fleets accept excessive downtime as inevitable. Leading operators use data-driven maintenance management to prevent failures, optimize repairs, and restore service rapidly. BusCMMS provides the visibility, analytics, and operational tools that enable fleet managers to reduce unplanned downtime by 40-60% and capture hundreds of thousands in cost savings annually. Schedule a consultation to analyze your fleet's downtime costs and create a customized improvement plan.