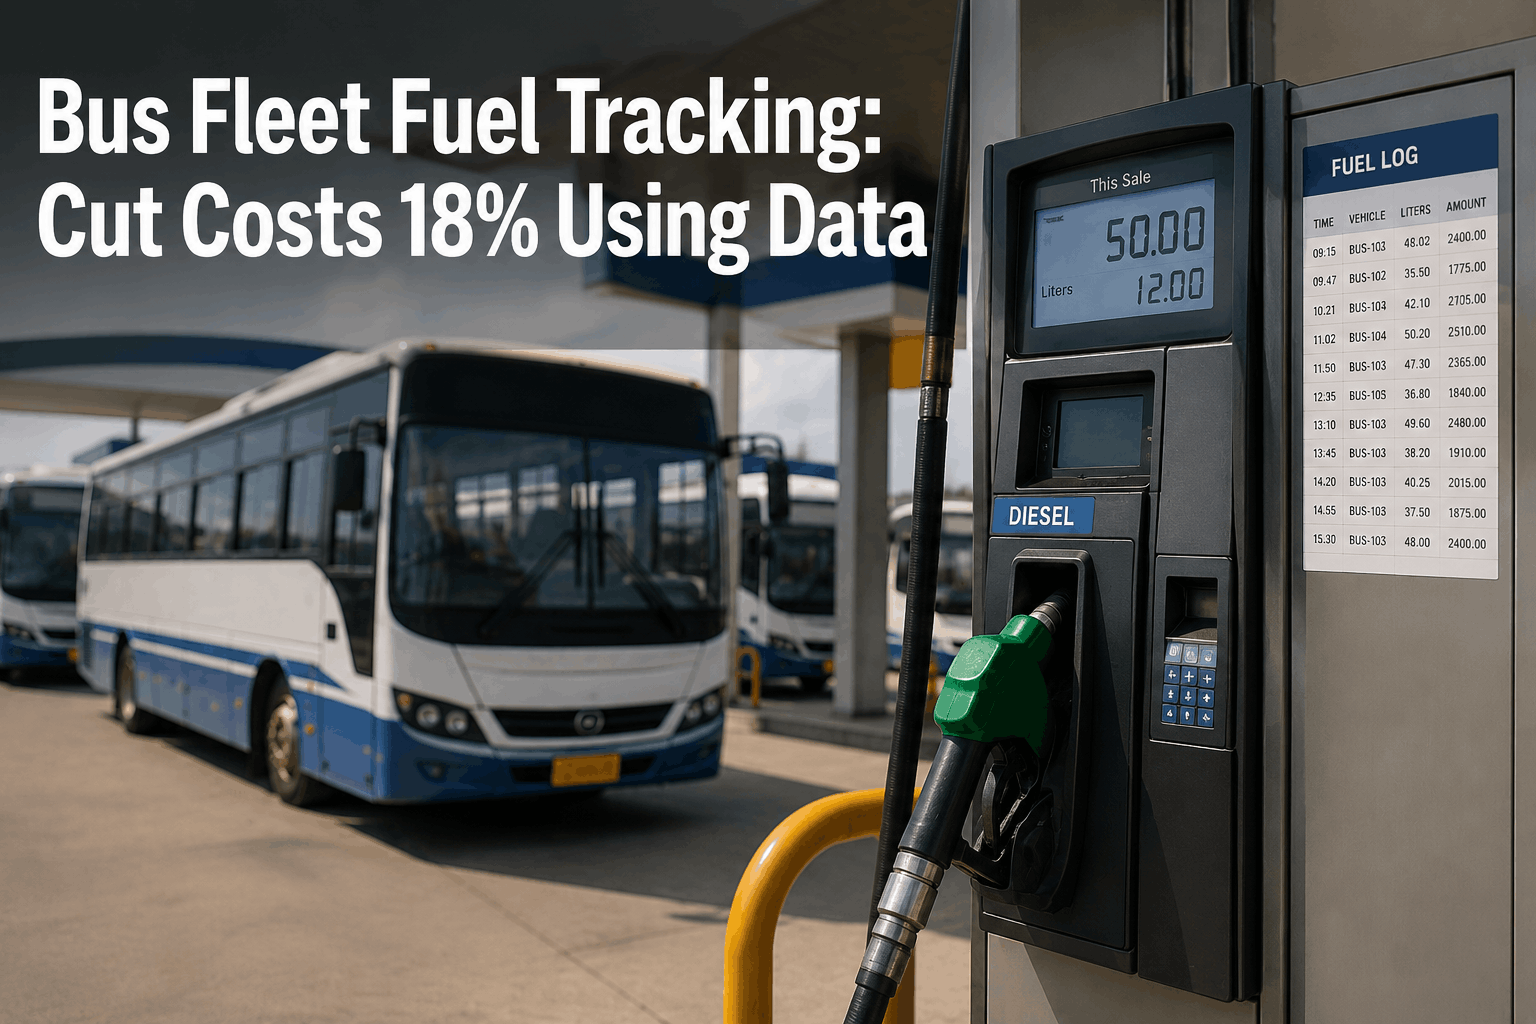
Fuel is the second-largest operating expense in most U.S. bus fleets — and for diesel-heavy school district and transit operations, it frequently ranks first. A single diesel bus consuming an average 8 MPG on 12,000 annual miles at $3.85 per gallon burns through $5,775 in fuel every year. Scale that to a 50-bus fleet and fuel spend reaches $288,750 annually before adding idle waste, theft losses, and route inefficiency. Yet the majority of U.S. bus fleet managers cannot tell you which specific buses are fuel-efficient and which are silently destroying their numbers — because fuel spend is tracked in aggregate, not at the vehicle level, and aggregate tracking hides the five specific leakage mechanisms that drain 18–22% of fuel budgets without ever triggering a single alert.
The 2023 Motive study found that almost 55% of fleet operators struggle to detect fuel fraud when it is happening to them, and 49% estimate up to 5% of their fuel spend is fraudulent. The WEX Fleet data places total theft and fraud losses at 19–22% of fleet spend for larger operations. The KPMG and Mercator Advisory Group research confirms fuel card fraud alone increases annual fleet spend by 5–10%. None of these losses require elaborate schemes — they accumulate through five predictable patterns that are invisible without per-vehicle, per-transaction fuel analytics: fuel theft and card fraud, excessive idle time, poor driver behavior, non-contracted station purchases, and maintenance-related fuel inefficiency. BusCMMS addresses all five through a single integrated fuel tracking platform that connects your fuel card provider, telematics system, and maintenance records — surfacing every anomaly before it becomes a quarterly budget problem.
Fuel cost reduction through data is not theoretical for U.S. bus fleets. The Department of Energy documents that route optimization alone produces 10–23.5% annual fuel savings for school districts. Idle time reduction through telematics enforcement cuts fuel waste by 40–60% on routes where excessive idling is identified. Driver behavior improvement — reducing harsh braking, aggressive acceleration, and speeding — improves MPG by 15–30% per affected bus. When these three levers are combined with fraud detection and maintenance-driven fuel efficiency monitoring, BusCMMS fleet data consistently shows 18% or better fuel cost reduction in the first 12 months of full tracking deployment. For a 50-bus fleet spending $288,750 in fuel, that is $51,975 in annual savings — recovered from money the fleet was already spending, not from operational cuts.
Fuel Cost Control Guide — 2026
Bus Fleet Fuel Cost Tracking: How to Cut Spend 18% and Stop Theft Using Real-Time Data
U.S. bus fleets lose 4–22% of annual fuel spend to theft, fraud, idle waste, and non-contracted station purchases — silently, because most fleets track fuel in aggregate, not per vehicle. Here is how BusCMMS fuel analytics catches every leak before it becomes a budget crisis.
What U.S. Fleets Lose Without Fuel Tracking
Fleet spend lost to fraud and theft
4–22%
Fuel wasted by excessive idling per bus
500+ gal/yr
MPG drop — poor driver behavior
15–40%
Fleet operators unable to detect fraud
55%
Fuel savings — BusCMMS full tracking
18–22%
01Why Fleet-Wide Fuel Averages Hide the Five Sources of Budget Leakage
Fuel is the second-largest operating expense in most U.S. bus fleets — and for diesel-heavy school district and transit operations, it frequently ranks first. A single diesel bus consuming an average 8 MPG on 12,000 annual miles at $3.85 per gallon burns through $5,775 in fuel every year. Scale that to a 50-bus fleet and fuel spend reaches $288,750 annually before adding idle waste, theft losses, and route inefficiency. Yet the majority of U.S. bus fleet managers cannot tell you which specific buses are fuel-efficient and which are silently destroying their numbers — because fuel spend is tracked in aggregate, not at the vehicle level, and aggregate tracking hides the five specific leakage mechanisms that drain 18–22% of fuel budgets without ever triggering a single alert.
The 2023 Motive study found that almost 55% of fleet operators struggle to detect fuel fraud when it is happening to them, and 49% estimate up to 5% of their fuel spend is fraudulent. The WEX Fleet data places total theft and fraud losses at 19–22% of fleet spend for larger operations. The KPMG and Mercator Advisory Group research confirms fuel card fraud alone increases annual fleet spend by 5–10%. None of these losses require elaborate schemes — they accumulate through five predictable patterns that are invisible without per-vehicle, per-transaction fuel analytics: fuel theft and card fraud, excessive idle time, poor driver behavior, non-contracted station purchases, and maintenance-related fuel inefficiency. BusCMMS addresses all five through a single integrated fuel tracking platform that connects your fuel card provider, telematics system, and maintenance records — surfacing every anomaly before it becomes a quarterly budget problem.
Fuel cost reduction through data is not theoretical for U.S. bus fleets. The Department of Energy documents that route optimization alone produces 10–23.5% annual fuel savings for school districts. Idle time reduction through telematics enforcement cuts fuel waste by 40–60% on routes where excessive idling is identified. Driver behavior improvement — reducing harsh braking, aggressive acceleration, and speeding — improves MPG by 15–30% per affected bus. When these three levers are combined with fraud detection and maintenance-driven fuel efficiency monitoring, BusCMMS fleet data consistently shows 18% or better fuel cost reduction in the first 12 months of full tracking deployment. For a 50-bus fleet spending $288,750 in fuel, that is $51,975 in annual savings — recovered from money the fleet was already spending, not from operational cuts.
02Fuel Theft and Card Fraud: The Leak Your Spreadsheet Will Never Find
Fuel theft in U.S. commercial fleets is not an edge case. The 2025 industry data shows that 73% of commercial fleets experience fuel theft annually, with internal theft — employees using company fuel cards for personal vehicles, card sharing, and PIN misuse — accounting for 62% of incidents. The average fleet loses approximately 5 gallons of attempted fuel fraud per vehicle per month according to FleetCor data — 1,200 gallons per year for a 20-bus fleet at $3.85 per gallon, that is $4,620 in fraudulent fuel annually. For a 50-bus fleet, exposure reaches $11,550 per year from this mechanism alone, before factoring in external card skimming or siphoning.
The three primary theft mechanisms that BusCMMS fuel tracking detects are location mismatch fraud, quantity anomaly fraud, and time-of-transaction fraud. Location mismatch — where a fuel card charges at a station that does not correspond to the vehicle's GPS position at the time of the transaction — is the most common and most detectable form. BusCMMS compares every fuel card transaction against the vehicle's telematics GPS position at the transaction timestamp. When Bus #38 charges fuel at a truck stop 340 miles from its route, the alert fires within minutes — not seven months later. Quantity anomaly detection flags transactions where the purchased fuel quantity exceeds the vehicle's tank capacity or is disproportionate to the mileage since the last fill. A 65-gallon purchase on a 50-gallon tank is physically impossible and indicates card sharing or fraudulent inflation of quantities. Time-of-transaction alerts flag fuel purchases at times when the vehicle is not scheduled to operate — weekend charges on buses assigned to school routes, late-night transactions on vehicles that should be parked at the depot.
Fleets using comprehensive monitoring systems — where GPS location, fuel card transaction data, and vehicle operational status are compared in real time — report 78% average theft reduction within the first year, according to HVI fleet data. The Georgia school district in our opening example recovered $11,400 after a seven-month exposure. Fleets with BusCMMS automated location matching would have received a same-day alert on the first fraudulent transaction — stopping the exposure at under $160 instead of $11,400. The difference is not the quality of the investigation. It is whether the detection is automated or manual.
Fuel Theft Detection: How BusCMMS Catches Each Pattern
High Risk
Location Mismatch
Card charges at a station that does not match the vehicle GPS position at transaction time. Most common theft pattern.
BusCMMS: Real-time GPS-to-transaction match — alert fires same day
High Risk
Quantity Inflation
Purchased gallons exceed tank capacity or are disproportionate to mileage since last fill — indicates card sharing or fraud.
BusCMMS: Per-vehicle tank size + telematics mileage validation per transaction
Medium Risk
Off-Hours Transactions
Fuel purchases occur when the bus is not scheduled to operate — weekends, late nights, or during school breaks on route buses.
BusCMMS: Schedule-aware transaction monitoring — flags off-hours charges instantly
Medium Risk
Non-Contracted Stations
Drivers fuel at stations outside your contracted network — paying 12–18 cents more per gallon than contracted rate.
BusCMMS: Station whitelist enforcement — flags any out-of-network purchase for review
Monitor
Card Skimming
External skimming devices at pumps steal card data for unauthorized use. FBI reports $1B+ annual losses industrywide.
BusCMMS: Velocity checks and pattern alerts flag rapid consecutive charges on same card
Monitor
Buddy Fueling
Drivers fuel personal or unauthorized vehicles using company cards — 38% of U.S. fleet drivers report seeing this at work.
BusCMMS: Gallons-per-mile ratio anomaly detection flags fills inconsistent with route mileage
See how BusCMMS fuel tracking catches theft patterns in real time — book a demo
03Idle Time: The $95,000 Annual Waste Most 50-Bus Fleets Are Ignoring
Excessive idling is the single largest controllable fuel waste source in school bus and transit operations — and it is entirely invisible without telematics-integrated per-bus fuel tracking. The U.S. Department of Energy documents that a diesel bus idling for one hour burns approximately 0.5–1.0 gallons of fuel. A school bus waiting at a school for 30 minutes before dismissal, idling at a train crossing, or warming up for 20 minutes in winter — those events add up to 500 or more gallons per bus per year for buses with chronic idling patterns. At $3.85 per gallon, that is $1,925 per bus annually in fuel doing nothing. For a 50-bus fleet with 20 buses exceeding the idling threshold, the annual waste reaches $38,500 — and a fleet where all 50 buses idle excessively loses $96,250 per year to idle waste alone.
The pattern is especially pronounced in school bus operations where drivers arrive early to staging areas, wait for dismissal in running vehicles to maintain HVAC comfort, and idle at railroad crossings and traffic-congested urban pickup zones. Transit buses face the same issue at terminal stops and layover points where engines remain running between routes. BusCMMS idle time tracking pulls real-time engine status data from your telematics integration and logs idle duration per bus, per driver, per route, and per location. When a bus exceeds your configured idle threshold — typically 5–10 minutes — the system logs the event and accumulates idle time data that feeds into the fuel waste report visible to both the fleet manager and the transportation director.
The idle time report in BusCMMS surfaces three actionable data points: which buses idle the most, which drivers are responsible, and which locations generate the most idle events. This three-dimensional view lets fleet managers address the problem at the right level — driver coaching for behavior-driven idling, route timing adjustment for schedule-driven idling, and depot rule enforcement for warm-up idling at the start of shift. Fleets that implement idle threshold alerts and driver behavior coaching based on telematics data reduce idling fuel waste by 40–60% within 90 days, according to BusCMMS fleet data. On a 50-bus fleet with $50,000 in annual idle waste, that 40–60% reduction represents $20,000–$30,000 in annual savings from a single operational change.
Annual Idle Fuel Waste Per Bus — By Daily Idle Time Category
Diesel bus — $3.85/gal — 0.75 gal/hour idle average
U.S. DOE: diesel engines burn 0.5–1.0 gal/hour at idle. School buses idling during dismissal, warm-ups, and layovers commonly exceed 2 hours daily. Source: BusCMMS fleet analytics, DOE fuel consumption data.
See Every Gallon. Flag Every Anomaly. Stop Every Leak. Automatically.
BusCMMS fuel tracking connects your fuel card provider, telematics system, and maintenance records — flagging theft, idle waste, driver behavior issues, and non-contracted purchases in real time. Per bus. Per driver. Per route.
04Driver Behavior Analytics: How Speeding and Hard Braking Destroy Fuel Economy
Driver behavior is the most underestimated fuel cost driver in bus fleet operations. The U.S. Department of Energy has documented that speeding, rapid acceleration, and hard braking reduce fuel economy by 15–30% at highway speeds and 10–40% in stop-and-go traffic — the exact operating profile of urban school bus and transit routes. For a diesel bus averaging 8 MPG under normal conditions, aggressive driver behavior can push actual fuel economy to 5.6–6.8 MPG — a degradation that costs $1,100–$2,175 more per bus per year in fuel alone. Across a 50-bus fleet where 20 drivers exhibit above-threshold aggressive behavior, the annual fuel cost premium reaches $22,000–$43,500, paid every year with no awareness and no corrective action because the data never surfaces in a fleet-wide fuel average.
BusCMMS driver behavior fuel tracking pulls acceleration, braking, and speed event data from your telematics integration and correlates it with each bus's actual MPG performance over rolling 30-day windows. The driver behavior fuel report ranks drivers by MPG performance, harsh event frequency, and estimated fuel cost above baseline — giving fleet managers the data to identify which drivers need coaching, which routes produce driving behavior issues due to traffic or road conditions, and how MPG improves after targeted driver training is delivered. The ranking is per driver, not per bus, preventing the common misattribution where a driver's poor behavior looks like a bus maintenance issue because the vehicle is blamed for poor MPG instead of the person operating it.
BusCMMS fleet data shows that fleets implementing driver behavior scoring with monthly MPG performance reviews achieve 12–18% MPG improvement per coached driver within 60 days — producing fuel cost reductions that compound across every route the improved driver operates. Combined with idle time reduction, the behavior and idle improvement levers together account for roughly 8–12 percentage points of the 18% total fuel savings achievable through BusCMMS tracking deployment. The remaining savings come from theft elimination, route optimization, and the maintenance-fuel efficiency connection described in the next two sections.
Driver Fuel Performance Scorecard — BusCMMS Analytics View
Driver
Avg MPG
Harsh Events/Wk
Idle Hrs/Day
Fuel Premium
Action
Driver A
8.4 MPG
2
0.6 hrs
Baseline
On Target
Driver B
7.1 MPG
9
1.4 hrs
+$820/yr
Coach Now
Driver C
8.1 MPG
3
0.9 hrs
+$210/yr
Monitor
Driver D
5.9 MPG
21
2.8 hrs
+$2,150/yr
Review Urgent
Driver E
8.2 MPG
4
0.7 hrs
+$180/yr
Monitor
Fuel premium calculated vs. fleet baseline MPG. Data auto-populated from telematics integration — no manual input. Driver D's behavior and idle pattern costs the fleet $2,150 per year above baseline — visible only with per-driver fuel analytics.
05Maintenance-Fuel Efficiency Link: How Degraded Components Kill Your MPG
Fuel consumption and vehicle condition are directly connected — and the connection is one of the most underutilized analytical signals available in a CMMS with integrated fuel tracking. Research published in bus fleet maintenance studies shows that fuel efficiency drops by 2.8–3.4% as engines approach their PM service windows, and degrades further when PM is delayed. Worn air filters alone reduce MPG by 6–14% on diesel buses. Degraded fuel injectors increase fuel consumption by 10–15% before producing a noticeable drivability symptom. Underinflated tires increase fuel consumption by approximately 0.2% per PSI below optimal — on a 10-PSI deficit across all six tires on a Type C bus, that is 1.2% fuel cost increase running continuously. DPF system degradation on diesel buses requiring active regeneration events burns additional fuel during regen cycles that does not appear in standard MPG calculations but appears in the fuel card data as higher-than-expected consumption for the mileage logged.
BusCMMS connects maintenance records to fuel consumption data in a way that no standalone fuel management tool can — because the maintenance data lives in the same system as the fuel analytics. When a bus's rolling 30-day MPG drops 8% below its baseline, BusCMMS cross-references the maintenance record and flags whether a PM service is overdue, whether the air filter was last replaced within interval, and whether any open work orders exist for components known to affect fuel efficiency. The system surfaces this correlation as a maintenance-fuel alert: "Bus #22 fuel efficiency dropped 9% in past 30 days — air filter PM overdue by 2,100 miles — schedule service." That alert converts a fuel cost anomaly into a maintenance action before the degradation becomes a component failure.
The reciprocal analysis — how fuel consumption changes after a PM service — is equally valuable for demonstrating maintenance ROI to leadership. When BusCMMS shows that Bus #44's MPG improved from 6.9 to 8.1 after a DPF service and air filter replacement, the fuel cost saving from that improvement ($540 annually at current fuel prices) is directly attributable to the maintenance investment. That data supports the maintenance department's budget request in terms leadership understands: the $320 DPF service paid for itself in 7 months through fuel savings alone. Without integrated fuel and maintenance tracking, that ROI calculation is impossible and the maintenance budget looks like pure cost instead of financial investment.
06Per-Bus Fuel Cost Tracking: Configuration and What the Data Reveals
Configuring per-bus fuel cost tracking in BusCMMS requires three integrations: your fuel card provider, your telematics/GPS system, and your vehicle asset registry. BusCMMS integrates with major U.S. fuel card providers including WEX, Fleetcor, Fuelman, Comdata, and others — pulling transaction-level data including station location, gallons purchased, dollar amount, and card identifier for every transaction. The telematics integration connects Samsara, Verizon Connect, Geotab, and other major platforms — providing real-time GPS position, odometer readings, engine status, and idle time data that BusCMMS uses to validate every fuel transaction and calculate per-mile fuel consumption continuously.
Once both integrations are active, BusCMMS automatically links every fuel card transaction to the vehicle assigned to that card, validates the transaction location against the vehicle's GPS position at the transaction time, calculates the MPG for the period between fills based on telematics odometer data, and posts the fuel cost to the vehicle's cost center for per-vehicle financial tracking. The per-bus fuel dashboard shows: current 30-day MPG vs. 90-day baseline, cumulative fuel cost year-to-date, cost per mile (fuel component), idle hours and estimated idle fuel waste, and any open fraud alerts or anomaly flags. For fleet managers, this transforms fuel from an opaque monthly line item into a live per-vehicle performance metric that drives daily operational decisions.
For school districts and transit agencies operating in states with contracted fuel supply agreements — where fuel must be purchased from designated providers at negotiated rates — BusCMMS station compliance tracking automatically flags every out-of-network purchase and generates a compliance report showing the premium paid above the contracted rate. The Phoenix charter fleet case study documented in BusCMMS data found $89,000 in annual fuel spend at non-contracted stations — 12–18 cents per gallon premium across a fleet that averaged 1.4 million gallons annually. That $89,000 was invisible in their fleet-wide fuel average and visible only when fuel card transaction data was analyzed per vehicle with station location validation.
Fuel Savings Breakdown — BusCMMS Tracking Impact by Category
50-bus diesel fleet — $288,750 annual fuel spend baseline
Theft and Card Fraud Elimination
Idle Time Reduction (40–60%)
Driver Behavior Coaching
Non-Contracted Station Elimination
Maintenance-Driven MPG Improvement
Total Annual Fuel Savings
$57,275 — approx. 20%
Conservative estimates based on BusCMMS fleet data. Actual savings vary by fleet size, current theft exposure, driver behavior baseline, and maintenance status.
"We operate 74 buses across two counties in North Carolina — a mix of school routes and activity runs. Before BusCMMS, we knew approximately what we were spending on fuel because our business office tracked the monthly fuel card statements. What we did not know was that two of our drivers were responsible for $31,000 of our $340,000 annual fuel bill between them — one from idle time, one from driving behavior. We also had three buses that had been fueling at a highway station 22 miles outside their routes for 11 months. BusCMMS caught all of it within 30 days of deployment. We recovered $6,800 from the vendor on the out-of-route transactions, coached the two high-cost drivers, and cut our idle time fleet-wide with a 10-minute auto-shutoff policy. Our fuel spend dropped $58,000 in year one. That was not from cutting routes or buying new buses — that was from knowing where the money was actually going."
Your Fuel Budget Is Leaking in Five Places. BusCMMS Finds All of Them.
Theft detection, idle tracking, driver behavior scoring, station compliance, and maintenance-MPG correlation — all in one platform. Per bus. Per driver. Per route. Real-time alerts. Automated location-to-transaction matching. Full fuel cost center integration with your accounting system. The only purpose-built bus CMMS platform that connects fuel data, maintenance records, and telematics in a single analytics view.
07How BusCMMS Fuel Analytics Differs From Standalone Fuel Cards and Telematics
Fleet operators often assume that having a fuel card program and a GPS telematics system means they have fuel tracking covered. What they have are two separate data sources that do not talk to each other — and the intelligence lives in the gap between them. A fuel card program shows you transaction data: when, where, how many gallons, and how much. A telematics system shows you vehicle data: where the bus was, how fast it was going, how long it idled, and what the odometer reads. Neither system alone can answer the questions that actually detect theft and quantify waste: was the vehicle at the station when the card was charged, does the gallons purchased match the mileage since the last fill, is this bus's MPG declining in a way that correlates with a missed PM service, and how much fuel did this specific driver waste to idling this week versus last week?
BusCMMS is the integration layer that connects both data sources — fuel card transactions and telematics vehicle data — and adds the third dimension that neither system has: maintenance history. When BusCMMS flags a bus for declining MPG, it simultaneously checks whether a PM service is overdue. When it flags a driver for excessive idle time, it connects the idle hours to the fuel cost in that driver's performance record. When it identifies a location mismatch on a fuel card transaction, it cross-references the vehicle's scheduled route for that time period and generates a fraud alert with complete context: vehicle, driver, time, GPS position, card transaction station, and variance amount. That three-source integration is available only when fuel tracking, telematics, and maintenance management are in the same platform — which is what BusCMMS delivers as a purpose-built bus fleet management system.
For U.S. school districts subject to state transportation audit requirements, BusCMMS fuel documentation also serves the compliance record. Every fuel transaction is permanently stored with its validation status — matched, flagged, or exception-resolved — creating an audit trail that satisfies state fuel program audits without manual documentation preparation. When your state transportation auditor asks for fuel consumption records for the past 24 months, BusCMMS generates the complete report in one click: every transaction, every bus, every driver, every anomaly, and every resolution. That is fuel accountability at the level that state oversight requires and that manual fuel card reconciliation cannot consistently deliver.
08Frequently Asked Questions: Bus Fleet Fuel Cost Tracking and Theft Prevention
How much fuel do U.S. bus fleets typically lose to theft and fraud annually?
Industry data shows U.S. commercial fleets lose 4–22% of annual fuel spend to theft and fraud depending on detection capabilities. The 2024 Motive Physical Economy Outlook found 14% of fleet payments were lost to fraud or theft industrywide, and the average fleet experiences approximately 5 gallons of fraudulent fuel per vehicle per month according to FleetCor data.
How does BusCMMS detect fuel card fraud automatically?
BusCMMS compares every fuel card transaction against the vehicle's real-time GPS position at the transaction timestamp — flagging any purchase where the card was used at a station that does not match the vehicle's location. Additional checks flag quantity anomalies (purchases exceeding tank capacity), off-hours transactions, and non-contracted station purchases automatically.
How much fuel does a school bus waste to excessive idling per year?
A diesel school bus idling 2 hours per day burns approximately 500+ gallons annually — nearly $1,928 in fuel at $3.85 per gallon doing nothing. For a 50-bus fleet with chronic idling patterns, idle waste reaches $50,000–$96,000 per year. BusCMMS idle tracking with threshold alerts reduces idle waste by 40–60% within 90 days of deployment.
What fuel card providers does BusCMMS integrate with?
BusCMMS integrates with major U.S. fuel card providers including WEX, Fleetcor, Fuelman, Comdata, and others — pulling transaction-level data including station location, gallons purchased, dollar amount, and card identifier. Every transaction is automatically matched to the vehicle assigned to that card and validated against GPS position data from your telematics provider.
How much can a bus fleet realistically save on fuel costs with data-driven tracking?
BusCMMS fleet data consistently shows 18–22% total fuel cost reduction in the first 12 months of full tracking deployment — combining theft elimination, idle reduction, driver behavior coaching, station compliance, and maintenance-driven MPG improvement. For a 50-bus fleet with $288,000 in annual fuel spend, that represents $51,840–$63,360 in annual savings.
How does driver behavior affect bus fuel economy and what does BusCMMS track?
The U.S. Department of Energy documents that speeding, hard braking, and aggressive acceleration reduce fuel economy by 15–40% depending on operating conditions. BusCMMS tracks harsh event frequency, actual MPG per driver over rolling 30-day windows, and calculates the fuel cost premium each driver generates above the fleet baseline — ranking drivers for targeted coaching.
Can BusCMMS connect fuel consumption data to maintenance records?
Yes — because fuel tracking and maintenance management are in the same platform, BusCMMS cross-references MPG trends against PM status and open work orders. When a bus's fuel efficiency drops, the system flags whether a PM service is overdue or whether a known fuel-efficiency-affecting component (air filter, injectors, DPF) has an open maintenance issue.
What is the most common form of bus fleet fuel fraud in U.S. operations?
Internal theft — employees using company fuel cards for personal vehicles, card sharing between drivers, and buddy fueling — accounts for 62% of fuel theft incidents in U.S. commercial fleets according to industry data. External card skimming is growing rapidly (700%+ increase in card skimming events since 2022 per FICO) but internal misuse remains the dominant exposure for bus operations.
How does BusCMMS fuel tracking support state transportation audit requirements?
Every fuel transaction in BusCMMS is permanently stored with its GPS validation status, anomaly flags, and exception resolution records — creating a complete audit trail that satisfies state transportation fuel program audits. Fleet managers generate a full 24-month fuel transaction report with one click, without manual documentation preparation or data compilation from multiple sources.
The Bottom Line
Fuel fraud costs U.S. commercial fleets 4–22% of annual fuel spend. Idle waste burns $1,900+ per bus per year on buses with chronic idling patterns. Driver behavior degradation cuts MPG by 15–40%. Non-contracted station purchases add 12–18 cents per gallon above contracted rates. Maintenance-related fuel inefficiency costs an additional 6–15% on buses with overdue PM services affecting fuel system components. None of these losses appear in a fleet-wide fuel average. All of them appear in BusCMMS per-vehicle fuel analytics — because BusCMMS connects fuel card transactions, telematics GPS data, and maintenance records in a single platform that surfaces every anomaly automatically. For the 74-bus North Carolina district, that visibility was worth $58,000 in year-one fuel savings. For the Georgia fleet, it stopped a $11,400 theft exposure at under $160 in week one. The fuel is already being purchased. The question is whether you know where it is going — and whether your system catches the answer before seven months of losses accumulate.
See BusCMMS fuel tracking in a live 20-minute demo — book your slot now
Five Leaks. One Platform. 18% Fuel Cost Reduction.
BusCMMS fuel tracking integrates fuel card transactions, telematics GPS data, and maintenance records — catching theft via location mismatch, quantifying idle waste per driver, scoring driver behavior by MPG impact, enforcing contracted station compliance, and flagging maintenance-driven fuel efficiency drops. Per bus. Per driver. Per route. Real-time alerts. State audit-ready documentation. The only purpose-built bus fleet CMMS that makes fuel a managed cost instead of a monthly surprise.