Transit agencies running 50 or more buses spend an average of $30,000 to $60,000 annually on emergency parts procurement — brake kits overnighted from across the country, coolant hoses sourced from a dealer at a 40% markup, filters pulled from a sister agency's shelf. Every one of those orders represents a failure of planning. Modern bus fleet CMMS platforms now use AI-driven parts forecasting to predict demand 60 to 90 days out, turning reactive scrambles into scheduled stock replenishment. This guide explains how it works, what it costs when you don't have it, and what to look for in a bus parts forecasting system built for American transit operations.
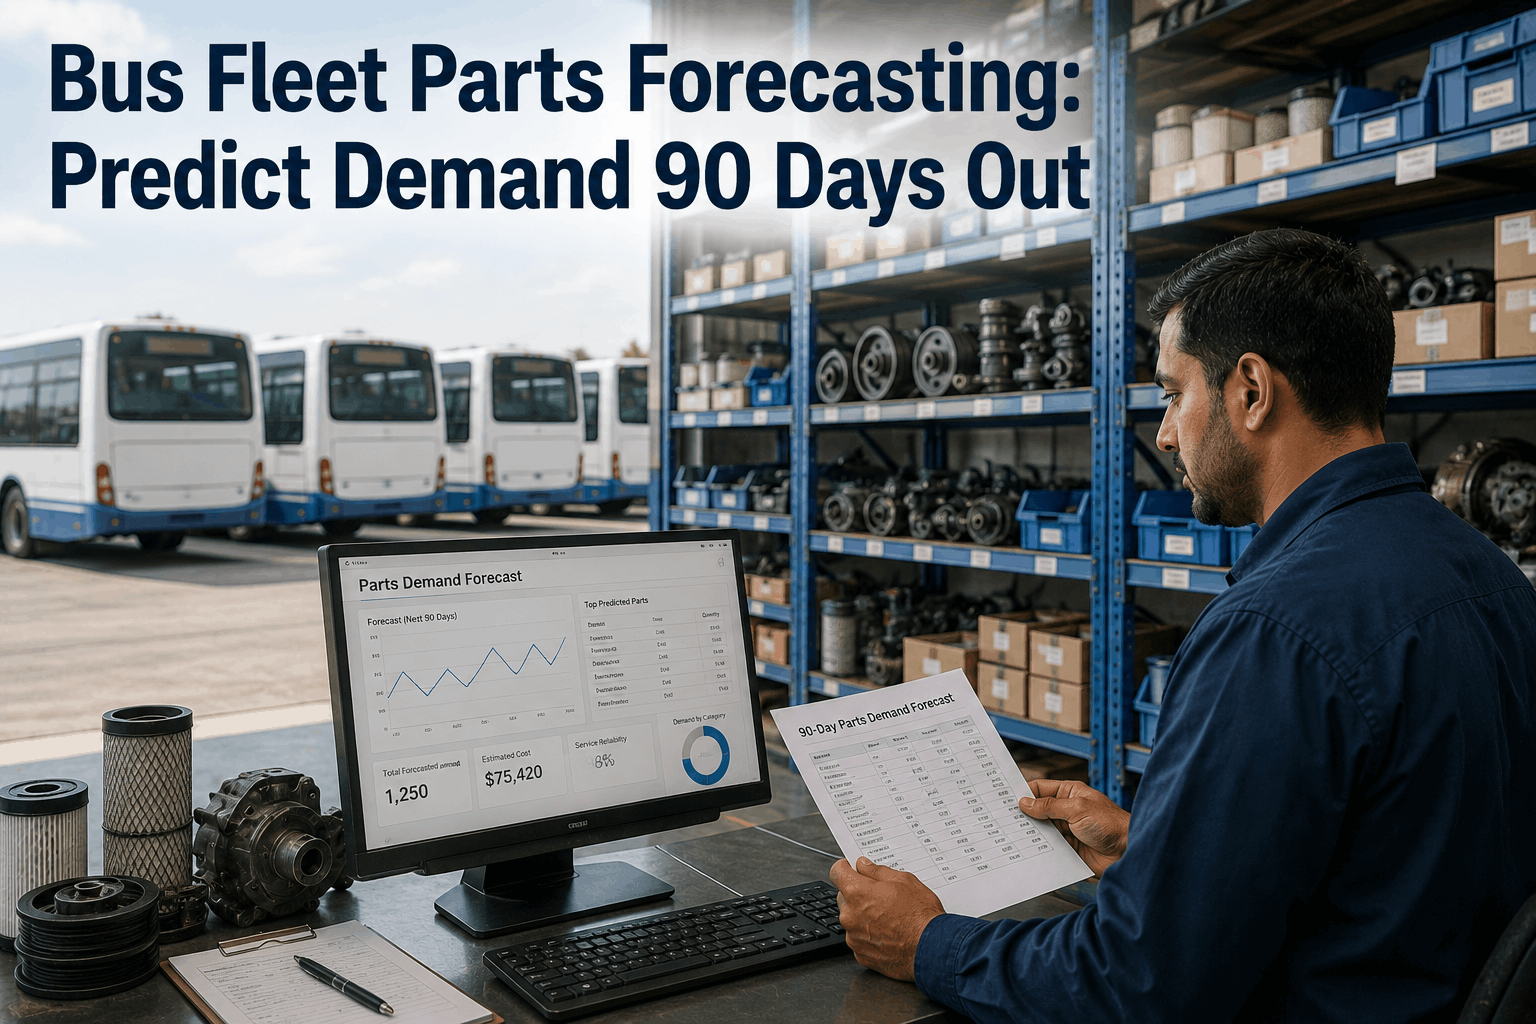
Bus Fleet Parts Forecasting: How to Predict Demand 90 Days Out and Eliminate Emergency Procurement Costs
AI-driven parts forecasting in bus fleet CMMS analyzes maintenance history, mileage accumulation, and seasonal failure patterns to predict what you'll need — before you need it.
Most transit agencies in the United States manage parts the same way they did in 1995: a storeroom with bins, a paper reorder log, and a fleet manager who knows from gut instinct that brake pads run low in November. That approach worked when fleets were smaller and parts lead times were predictable. It breaks down completely in 2025, when a 40-bus fleet runs multiple engine families, suppliers have 6–10 week lead times on critical components, and a single bus off the road costs $800 to $1,200 per day in lost service.
The core problem is that reactive and even preventive parts management are both wrong by design. Reactive management means you order parts after a bus goes down — guaranteeing downtime. Preventive management means you stock based on a schedule, not on what your fleet's actual mileage and failure patterns demand — resulting in overstocked shelves of parts you won't use for 18 months, and stockouts on the things that actually fail. Predictive parts forecasting solves both problems simultaneously by using your fleet's own data to tell you what it will need, and when.
Parts forecasting in a modern bus CMMS is not a spreadsheet formula. It's a model that continuously learns from four data streams unique to your fleet: maintenance history by vehicle and component, mileage accumulation rates by route, seasonal failure patterns observed over multiple years, and supplier lead time performance. When those four streams converge, the system can predict with greater than 95% accuracy which components each bus will need — and when — up to 90 days in advance.
Here's the data flow that makes it work. Every completed work order in BusCMMS records which part was used, on which vehicle, at what mileage, and under what conditions. Over 12 to 18 months of operation, the system builds a failure probability model for every part-vehicle combination in your fleet. Add mileage projections from route scheduling and the model knows not just that a bus will need brake pads, but which bus, on approximately what date, at what confidence level. Seasonal patterns layer on top: suspension components fail more frequently in northern states after winter road salt exposure; cooling system parts spike in July and August; fuel system parts degrade faster in extreme cold starts.
See BusCMMS parts forecasting running on a live fleet — schedule a demo
Not every part in your storeroom needs AI forecasting — some high-velocity consumables like oil filters can be managed with simple par-level reordering. But for the components that cause the most downtime and carry the highest emergency procurement cost, predictive demand modeling delivers outsized returns. These are the seven categories where US bus fleets consistently see the fastest payback.
Brake components are the single highest-priority category for predictive forecasting in US bus fleets. City routes with frequent stops create aggressive brake wear cycles that vary dramatically between vehicles — a bus running downtown express stops may need brake pads 40% sooner than the same model running a suburban loop. BusCMMS tracks brake wear by route and vehicle, not just by calendar interval, giving you an accurate demand signal rather than a generic mileage estimate.
HVAC and cooling system parts represent the biggest seasonal forecasting win. Summer peaks in July and August drive compressor, fan clutch, and coolant component failures across the South and Midwest. BusCMMS users in Texas, Florida, and the Carolinas have used seasonal pattern data to pre-stock cooling components in May — eliminating the scramble that typically starts in late June when every fleet manager in the region is calling the same distributors simultaneously.
Start tracking part usage by vehicle and route — sign up free
Fleet managers evaluating a bus CMMS with parts forecasting often ask the same question: how different is it really from what we're doing now with our inventory spreadsheet and our PM schedule? The answer is: fundamentally different. Here's how the two approaches compare across the metrics that determine your actual parts cost and bus availability.
| Management Dimension | Spreadsheet / Par-Level | BusCMMS Predictive Forecasting |
|---|---|---|
| Demand signal | Fixed par levels set manually | Vehicle-specific failure probability model |
| Forecast horizon | Days to 2 weeks | 60–90 days forward visibility |
| Seasonal adjustment | Manual, if at all | Automatic from multi-year history |
| Emergency orders/year | 20–40+ per 50 buses | 3–7 per 50 buses (73% reduction) |
| Overstock carrying cost | High — stocked by assumption | 25–40% lower — stocked by data |
| Supplier lead time use | Generic assumptions | Vendor-specific actual lead time data |
| Warranty claim capture | Manual, often missed | Automated — $15K–$25K/yr per 100 buses |
| Reorder process | Manual, manager-dependent | Auto-generated PO drafts for approval |
| Annual emergency cost | $30K–$60K (50 buses) | Under $8K with forecasting active |
Walk through the comparison with your own fleet data — schedule a demo
The most common question fleet managers ask before implementing BusCMMS parts forecasting is whether they need years of clean historical data before the system works. The answer is no — but the quality of forecasting improves significantly over the first 12 to 18 months as the system builds its vehicle-specific failure models. Here's the realistic implementation roadmap for a US transit agency starting from scratch.
Abstract accuracy percentages don't mean much to a fleet manager building a parts budget. What matters is what that accuracy translates to in dollars and bus availability. Here's a concrete breakdown for a 50-bus fleet, comparing a typical reactive operation to a BusCMMS predictive forecasting operation in the same fleet size and route profile.
The warranty recovery line is frequently the biggest surprise for fleet managers reviewing this comparison. Fleets with manual or spreadsheet-based parts management capture an average of 30–40% of their eligible warranty claims, because documentation is incomplete or deadlines are missed. BusCMMS automated warranty tracking ensures every part installation is documented with install date, mileage, and associated work order — creating an audit-ready warranty claim package that typically recovers $15,000 to $25,000 annually per 100 buses.
Want to see what your fleet's forecasting savings would look like? Book a demo
General fleet management software and enterprise CMMS platforms typically treat bus fleets as just another vehicle category. They apply the same parts management logic used for delivery vans or construction equipment. Bus operations have fundamentally different requirements: multi-door configurations with high-cycle mechanisms, air brake systems with DOT inspection obligations, route-specific wear profiles that vary by stop frequency, and ADA compliance requirements that create unique parts demand patterns. BusCMMS is purpose-built for bus operations — and that difference is visible in every part of the forecasting system.
We were spending close to $42,000 a year in emergency parts orders for our 62-bus fleet — brake kits on overnight freight, HVAC compressors pulled from a dealer at full retail. After six months with BusCMMS, our emergency procurement dropped to under $9,000. The system flagged a wave of cooling system demand for July two months early. We ordered in May at contract pricing. Not one bus went down for a cooling issue all summer. That was a first for us.
Transit agency boards and finance committees approve CMMS investments based on documented ROI — not on the promise of better organization. The good news is that parts forecasting has a uniquely measurable cost reduction story that translates directly into budget line items. Here's how to frame the case using your own fleet data, and what BusCMMS provides to support the presentation.
Start with your last 12 months of parts spending and identify four numbers: total emergency parts orders placed, total freight premium paid on emergency orders, total labor hours lost waiting on parts, and total warranty claims submitted versus total eligible events. These four numbers are your baseline. BusCMMS tracks all four going forward — so your board will see a before-and-after comparison at the next annual budget review, not just a projection.
The payback calculation for most 40–80 bus fleets is straightforward. Emergency procurement savings alone ($20,000–$45,000 annually for fleets in this range) typically exceed the annual BusCMMS software cost. Warranty recovery and carrying cost reduction make the ROI model even more compelling — and the system's 4-month average payback period means you're cash-positive before the first annual renewal.
Parts management is the invisible cost center that most transit boards don't scrutinize closely enough — because the failures are diffuse. A $1,200 overnight freight bill here, two hours of tech idle time there, a warranty claim never filed on a $340 brake caliper. None of these events triggers an alarm. Collectively, for a 50-bus fleet, they add up to $30,000 to $60,000 a year in fully avoidable costs.
The agencies I've seen close that gap fastest share one characteristic: they started capturing work order data digitally before they worried about what to do with it. The forecasting model is only as good as the history it learns from. BusCMMS makes the data capture easy enough that technicians actually use it — mobile work orders, barcode scanning for parts, mileage auto-pull from daily inspections. Once the data flows, the intelligence follows.
The 90-day forecasting window is the number that matters most operationally. A 14-day forecast barely beats a phone call to your distributor. A 90-day window lets you order on a planned purchase order, negotiate quantity pricing, consolidate freight, and schedule the PM job when a bay is available — not when the bus breaks down on Route 12 at 6am on a Tuesday.
Bus fleet parts forecasting is not a nice-to-have feature for large transit authorities. It is a fundamental cost control capability for any fleet of 20 buses or more operating in the United States. The math is simple: emergency procurement costs between $30,000 and $60,000 annually for a 50-bus fleet, predictive forecasting reduces that by 70% or more, and BusCMMS pays for itself in four months on emergency freight savings alone — before counting warranty recovery, overstock reduction, and labor efficiency gains.
The agencies winning on parts cost right now are not the ones with the biggest budgets. They're the ones who started capturing clean work order data 12 months ago and are now letting BusCMMS turn that history into forward-looking demand forecasts. Every week you run on spreadsheets and gut instinct is another week of avoidable emergency orders, missed warranty claims, and overstock that ties up capital you could use elsewhere.
BusCMMS is purpose-built for bus fleet operations — not adapted from a general fleet CMMS. The parts taxonomy, the DOT compliance linkages, the route-aware wear modeling, and the bus-specific PM schedules are all designed for the way transit agencies actually operate. Whether you run 20 school buses or 200 transit coaches, the forecasting system scales with your fleet.
Sign up free and start building your parts forecast database today