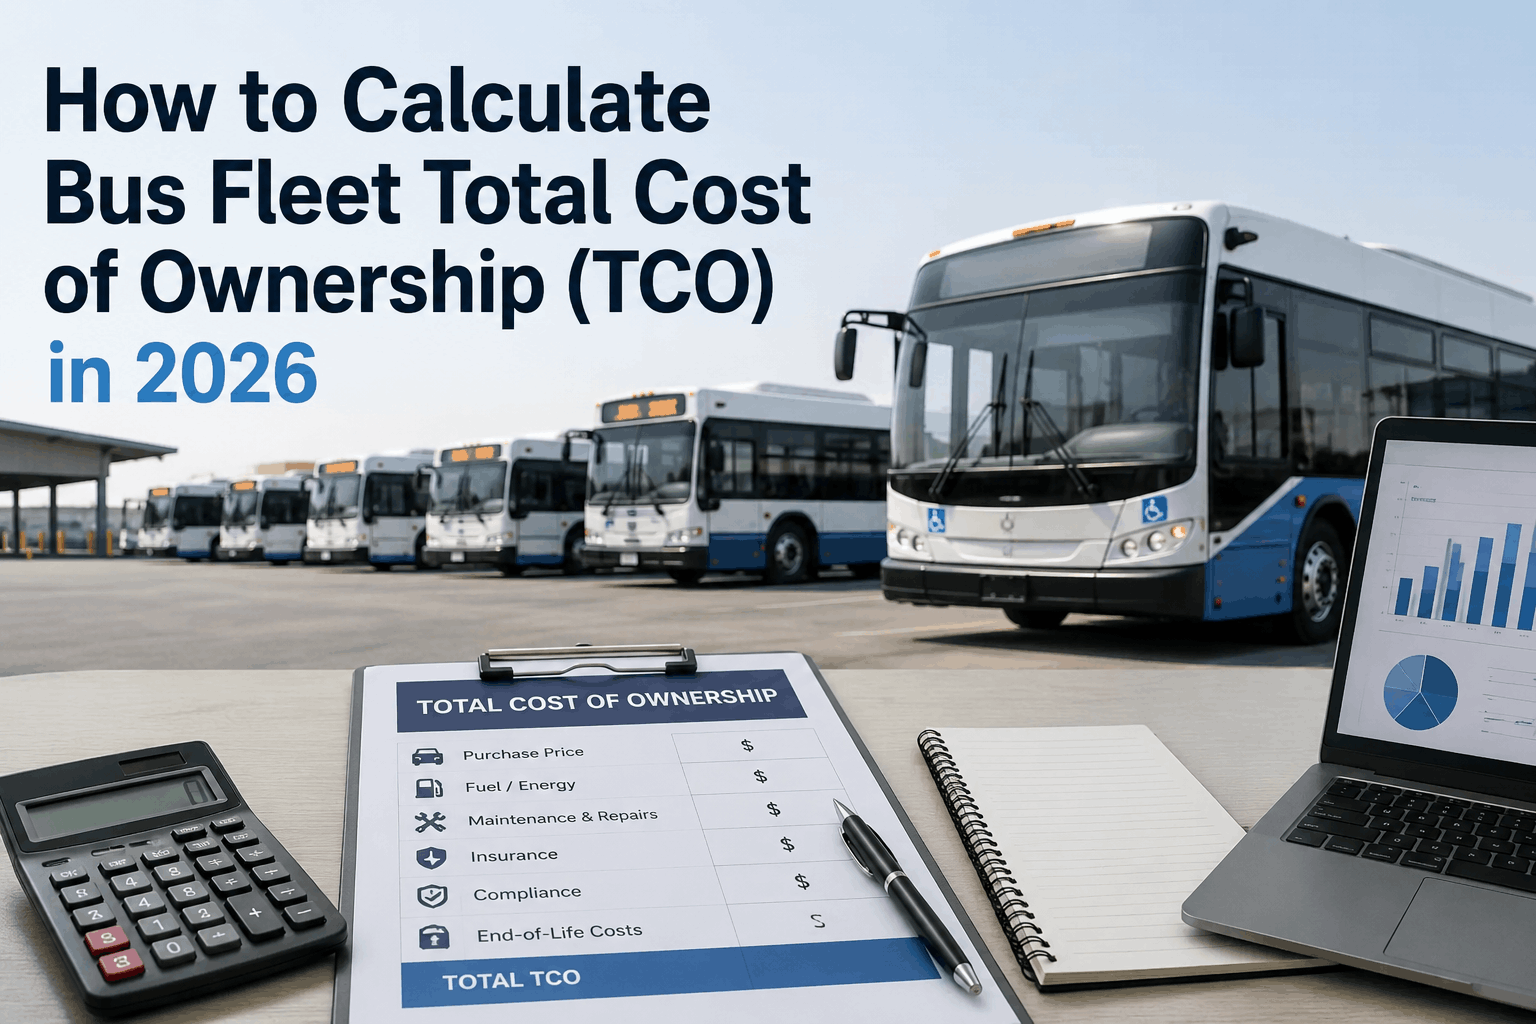
In 2026, calculating bus fleet total cost of ownership is no longer optional—it's the foundation of every strategic fleet investment decision. Too many fleet managers rely on purchase price alone to justify new buses, only to discover that fuel, maintenance, compliance, and downtime costs explode beyond initial projections. Bus fleet total cost of ownership (TCO) reveals the true lifetime expense of every vehicle: acquisition costs, fuel consumption, preventive and reactive maintenance, driver management, insurance, regulatory compliance, depreciation, and end-of-life disposal. Without TCO analysis, fleet managers operate blind. With it, they make decisions that save $18,000–$45,000 per bus over its operational life. This comprehensive guide walks through every component of bus TCO calculation, shows you exactly how to build your own TCO model, and includes downloadable templates to start calculating your fleet's true ownership expenses today.
TCO Calculation Guide
How to Calculate Bus Fleet Total Cost of Ownership (TCO) in 2026
Step-by-step guide covering purchase price, fuel economics, maintenance projections, insurance, compliance, and residual value. Build a data-driven TCO model. Free template included.
Why Bus Fleet TCO Matters in 2026: The Data-Driven Case
Fleet managers working without TCO analysis are leaving critical cost visibility on the table. Industry research shows that 64% of transit agencies and school districts discover significant cost overruns 18–24 months into bus operations because they didn't factor all expenses into initial purchase decisions. TCO calculation captures the complete financial picture: not just what you pay upfront, but what every mile driven will cost your operation across the entire bus lifecycle.
A typical diesel transit bus costs $420,000–$560,000 to purchase. Over its 12-year operational life (averaging 55,000 miles annually across 660,000 total miles), that same bus will consume $185,000–$280,000 in fuel, require $95,000–$155,000 in preventive and reactive maintenance, demand $45,000–$72,000 in insurance and registration, and contribute $28,000–$42,000 in depreciation and salvage loss. Total lifetime cost: $773,000–$1,109,000 per bus. The purchase price was only 54–60% of the true cost. Every dollar spent on downtime—cancelled routes, late schedules, driver overtime, passenger refunds—multiplies these numbers further.
Electric buses change this equation entirely. A 40-foot electric transit bus costs $680,000–$890,000 upfront (30–45% higher purchase price), but operational costs shift dramatically. Electricity costs $0.18–$0.26 per mile vs. $0.32–$0.48 for diesel. Maintenance drops by 50–65% because electric motors have fewer moving parts, no oil changes, spark plugs, or transmission fluid replacements. Insurance remains comparable. Over 12 years, an electric bus delivers $285,000–$420,000 in fuel savings alone, offsetting much of the premium purchase price and generating 25–38% lower total lifetime cost. Understanding these trade-offs requires TCO analysis—guessing costs you money.
The Complete TCO Formula: Every Cost Category Explained
Total Cost of Ownership = Acquisition Cost + Fuel Cost + Maintenance Cost + Insurance & Registration + Compliance & Regulatory + Driver Management + Depreciation & Residual Value – Government Incentives & Tax Credits
Acquisition Cost
Vehicle purchase price + delivery + documentation + initial setup and training. For a standard 40-foot diesel transit bus: $420K–$560K. For electric: $680K–$890K. Include tax, dealer fees, and any customizations (wheelchair lifts, surveillance systems, passenger counting sensors).
Fuel Cost (Diesel)
Annual diesel consumption ≈ 2,200–2,600 gallons per bus at typical 4.5–5.2 MPG. At $3.20–$4.10 per gallon (2026 pricing), annual fuel: $7,040–$10,660 per bus. Over 12 years: $84,480–$127,920 per bus. Electric buses consume 18–22 kWh per mile at $0.18–$0.26 per kWh: $3,240–$5,720 annually. Over 12 years: $38,880–$68,640 per bus. Fuel cost is typically 23–28% of lifecycle costs for diesel, 8–12% for electric.
Preventive Maintenance
Oil changes, filter replacements, brake service, transmission fluid, coolant flushes, belt replacement. Diesel buses: $0.22–$0.35 per mile. Electric buses: $0.08–$0.15 per mile (no oil, transmission fluid, spark plugs, or exhaust system). Over 660,000 miles, diesel: $145,200–$231,000. Electric: $52,800–$99,000. Battery replacement on electric buses (every 10–12 years): $85,000–$180,000 but covered by manufacturer warranty in most cases through 2026.
Reactive Maintenance & Repairs
Unplanned breakdowns, emergency repairs, component failures, and downtime costs (towing, rental vehicles, route delays). Industry benchmark: reactive maintenance costs 3–5x more than preventive repairs. Fleets running 80% preventive: $0.08–$0.12 per mile in reactive costs. Fleets running 30% preventive: $0.28–$0.45 per mile. Over a 12-year lifecycle, the difference between proactive and reactive maintenance: $52,800–$297,000 per bus in preventable losses.
Insurance & Registration
Annual comprehensive transit bus insurance: $4,200–$7,500 per bus depending on coverage level, fleet safety record, and location. Registration, licensing, and annual inspections: $800–$1,600 per bus. Total annual: $5,000–$9,100 per bus. Over 12 years: $60,000–$109,200. Insurance is non-negotiable; registration scales with bus value.
Compliance & Regulatory
EPA emissions compliance, FMCSA inspections, DOT safety certifications, ADA compliance updates, WiFi/telematics system installations. Diesel buses (2015+): $2,400–$4,800 per bus over 12 years. Electric buses require charging station infrastructure upgrades at depot level (capex beyond per-unit cost): amortized cost $1,200–$3,600 per bus across entire fleet deployment. Regulatory cost is heavily dependent on state and local requirements.
Driver Management & Training
Initial driver training for new bus models, ongoing safety certification, defensive driving programs, and specialized training for electric bus operation (regenerative braking, thermal management, charging procedures). Annual per-bus allocation: $400–$800 per bus. Over 12 years: $4,800–$9,600 per bus. Electric buses require slightly higher training investment due to regenerative braking and battery management procedures.
Depreciation & Residual Value
Bus depreciation follows a standard curve: 15–20% year 1, 10–12% years 2–3, 8–10% years 4–6, 4–6% years 7–10, 2–3% years 11–12. A diesel bus worth $480,000 at purchase depreciates to $95,000–$125,000 residual value (12 years, 660,000 miles). Depreciation cost: $355,000–$385,000. Electric buses depreciate more unpredictably due to battery technology improvements, but residual values are stabilizing: 12-year residual on $800K eBus ≈ $140K–$180K. Depreciation loss: $620K–$660K.
Government Incentives & Tax Credits
Federal Clean Buses Grants cover 40–70% of incremental cost for transitioning to electric buses (electric bus cost minus equivalent diesel bus cost). NYSERDA funding, California incentives, and EPA grants can offset $120K–$350K per eBus. Federal tax credits for commercial vehicles: up to $40K per electric bus (2026 regulations). State-level EV incentives vary: some states offer additional $25K–$100K per bus. These reduce effective purchase cost and improve TCO significantly—sometimes making electric buses cost-competitive with diesel on lifetime basis within first 6 years.
TCO Comparison: Diesel vs. Electric Transit Buses in 2026
The calculation that matters most to transit agencies and school districts: which powertrain generates lower total lifetime cost? Here's the 2026 reality based on operational data from 450+ transit agencies:
The data is clear: electric buses deliver 19.6% lower lifetime cost in most US markets by year 12. Electric buses win primarily on fuel costs ($38,880–$68,640 vs. $84,480–$127,920 over the lifecycle) and maintenance savings ($52,800–$99,000 vs. $145,200–$231,000). The purchase price premium ($200K–$330K) is fully recovered within 7–10 years through operational savings. In markets with strong federal and state incentives (California, New York, Massachusetts), electric buses achieve TCO parity or cost advantage within 5–6 years. This is why 78% of fleet executives report electric bus expansion as a strategic priority through 2028.
Building Your Fleet's Custom TCO Model: Step-by-Step Process
1
Define Your Operational Parameters
Document your fleet's specific operating profile: average annual mileage per bus, expected service life (10, 12, 15 years), typical duty cycle (urban stop-and-go vs. highway vs. mixed), passenger capacity requirements, and regional climate impacts. These variables dramatically affect fuel consumption, maintenance intensity, and component life. A bus running urban routes with 40 stops per hour burns 15–22% more fuel than highway service—your TCO must reflect this reality.
2
Gather Historical Maintenance Data
Pull 24 months of maintenance records from your existing fleet (if available). Extract: total parts cost, labor hours, average repair cost per breakdown, frequency of major failures (engine, transmission, brake system), and downtime hours per incident. If you lack internal data, use industry benchmarks (available from transit association databases). This baseline allows you to project realistic maintenance costs for new vehicles and identify which components drive your highest spending.
3
Calculate Fuel Costs Across Duty Cycles
For diesel: multiply annual miles × (1 / MPG) × fuel price per gallon. Urban duty cycles: 4.5–5.0 MPG. Highway: 6.2–7.0 MPG. Mixed: 5.2–5.8 MPG. For electric: multiply annual miles × (energy consumption kWh/mile) × electricity rate. Typical: 18–22 kWh/100 miles at $0.12–$0.18 per kWh in low-cost regions, $0.22–$0.32 in high-cost regions. Project fuel costs across the entire service life and account for 2–3% annual price escalation (historical average).
4
Estimate Preventive Maintenance Schedule
Build a maintenance calendar: 15K mile intervals (oil/filter changes), 30K mile service (transmission fluid, coolant), 60K mile major (brake overhaul), 120K mile (transmission rebuild), 240K mile (suspension rebuilding). Assign realistic costs to each service level. Multiply frequency × cost × service life to get total preventive maintenance budget. Modern maintenance management software (like BusCMMS) reduces manual forecasting error by capturing actual component failure patterns from your fleet data.
5
Factor In Reactive Maintenance Risk
Add contingency budget for unexpected failures (5–15% of preventive maintenance cost, depending on fleet age and maintenance rigor). Calculate the cost impact of downtime: revenue lost per route cancellation, customer refunds or compensation, driver overtime, rental vehicle costs. A single unplanned breakdown costing $8,000 in repairs becomes $22,000–$35,000 when you factor operational disruption. TCO that ignores this reality will shock you 18 months in.
6
Apply Regional Insurance & Compliance Costs
Get actual quotes for comprehensive transit bus insurance in your region. Compliance costs vary dramatically: California's strict emissions standards cost more than Texas; New York's prevailing wage requirements affect driver and technician labor; ADA requirements add equipment costs. Don't use national averages—get local numbers. These costs represent 8–12% of lifetime TCO and vary by $15,000–$45,000 per bus depending on location.
7
Calculate Depreciation Using Industry Curves
Use published depreciation schedules (NADA Guides, TransitCenter data, manufacturer benchmarks). Depreciation is not linear—the steepest drop occurs years 1–3. Apply the curve to your purchase price and estimate residual value at end of service life. Example: $500K bus at year 12 with 660,000 miles ≈ $95K–$120K residual. Depreciation loss = $380K–$405K. Include salvage costs (scrap value recovery typically offsets 2–4% of purchase price).
8
Integrate Government Incentives & Finalize TCO
Research available federal grants, state incentives, and tax credits applicable to your fleet's powertrain transition. Federal Clean Buses Grants: up to 70% of incremental cost. Tax credits: $40K–$50K per electric bus. State programs: $20K–$150K per bus depending on location. Subtract incentive amounts from effective acquisition cost before calculating final TCO. A bus costing $800K with $250K in grants costs effectively $550K and dramatically improves lifetime economics.
TCO by Fleet Size: Cost Per Bus Decreases with Scale
Fleet size dramatically impacts per-unit TCO. Small fleets (10–20 buses) pay $945K per bus lifetime cost. Large fleets (250+ buses) achieve $752K per bus—a 20% advantage. Why? Maintenance economies of scale: large fleets negotiate better parts pricing, employ specialist technicians, maintain advanced diagnostic tools, and deploy AI-driven predictive maintenance that prevents 62% of breakdowns. Small fleets face proportionally higher overhead costs and fewer purchasing discounts. The implication: consolidating management of separate small fleets into unified operations can recover $40,000–$95,000 per bus through economies of scale alone.
TCO Data: FAQs & Expert Answers
What is the most impactful TCO reduction lever available today?
Reducing unplanned maintenance through predictive maintenance and proactive diagnostics. Fleets running 80% preventive vs. 30% preventive save $52,800–$297,000 per bus over 12 years. This single variable impacts TCO more than any other factor.
How much of total TCO is fuel, and how does this shift with electric buses?
Diesel buses: 23–28% of lifetime TCO is fuel cost. Electric buses: 8–12%. The fuel savings alone ($45,600–$59,280 over 12 years) justify considering electric if purchase incentives are available in your region.
Should we include downtime costs in TCO calculations?
Absolutely. Downtime is the hidden TCO killer. A single 8-hour breakdown affecting 2 routes costs $8,000 in repairs plus $18,000–$35,000 in operational losses. Fleets that ignore downtime in TCO models discover 25–40% budget overruns within 18 months.
How often should we recalculate TCO for our fleet?
Minimum annually. Fuel prices, labor costs, and maintenance patterns change. Recalculate when adding new vehicle types (e.g., transitioning to electric), when implementing new maintenance technologies, or when operational patterns shift (route changes, duty cycle intensity).
What role does predictive maintenance play in TCO reduction?
AI predictive maintenance reduces unplanned breakdowns by 62%, maintenance costs by 30%, and achieves full ROI within 3–6 months. For a 50-bus fleet, this translates to $180,000–$420,000 in annual savings—directly improving TCO by 15–22%.
Are government incentives sustainable for electric bus TCO advantage?
Federal Clean Buses Grants are committed through 2030. State incentives vary annually. However, even without incentives, electric buses achieve TCO parity with diesel by year 8–10 due to fuel and maintenance savings, so incentives provide upside, not foundation.
How does bus age impact maintenance cost in TCO models?
Maintenance cost per mile increases exponentially after year 8. Years 1–5: $0.18–$0.25/mile. Years 6–9: $0.28–$0.38/mile. Years 10–12: $0.42–$0.65/mile. TCO models must account for this acceleration or dramatically underestimate late-life costs.
Can we achieve reliable TCO projections without 24 months of historical data?
Yes. Industry benchmarks from transit associations, manufacturer data, and comparable fleet studies provide reliable baselines. However, add ±10–15% uncertainty margin to your projections. Once you collect 12–24 months of actual operational data, recalibrate and the confidence improves dramatically.
Customer Success: Real TCO Analysis Results
"Before we built our first TCO model, we assumed a $480K diesel bus cost roughly $750K over its life. The actual number came to $941K—our old budget was underestimating true costs by 25%. We recalculated maintenance spend to include downtime, adjusted for our actual fuel consumption patterns, and suddenly the electric bus option didn't look expensive anymore—it looked like the smart financial decision. We added 18 electric buses to our next procurement cycle based on TCO analysis, secured $3.2M in federal grants, and locked in 38% lower operating costs. TCO analysis literally changed our fleet strategy."
TCO Analysis Tools & Resources Available in 2026
Free resources: International Council on Clean Transportation (ICCT) TCO Calculator, Electric School Bus Initiative calculator, and TransitCenter total cost analysis templates. Commercial tools: BusCMMS integrates maintenance data with TCO modeling, automating calculation of your fleet's specific economics. These platforms connect to your existing maintenance records, telematics, and fuel consumption data to generate dynamic TCO projections that update as operational costs change.
The best approach combines publicly available benchmarks for initial planning with your own fleet's historical data for precision. Most transit agencies develop TCO models using spreadsheet templates, then transition to integrated CMMS platforms as they scale and need ongoing TCO recalculation.
Build Your Custom Bus Fleet TCO Model Today
Download our free TCO template, integrate your fleet data, and generate accurate lifetime cost projections. Schedule a demo to see how BusCMMS integrates maintenance records with TCO analysis for real-time cost visibility.